Why Monitoring Matters
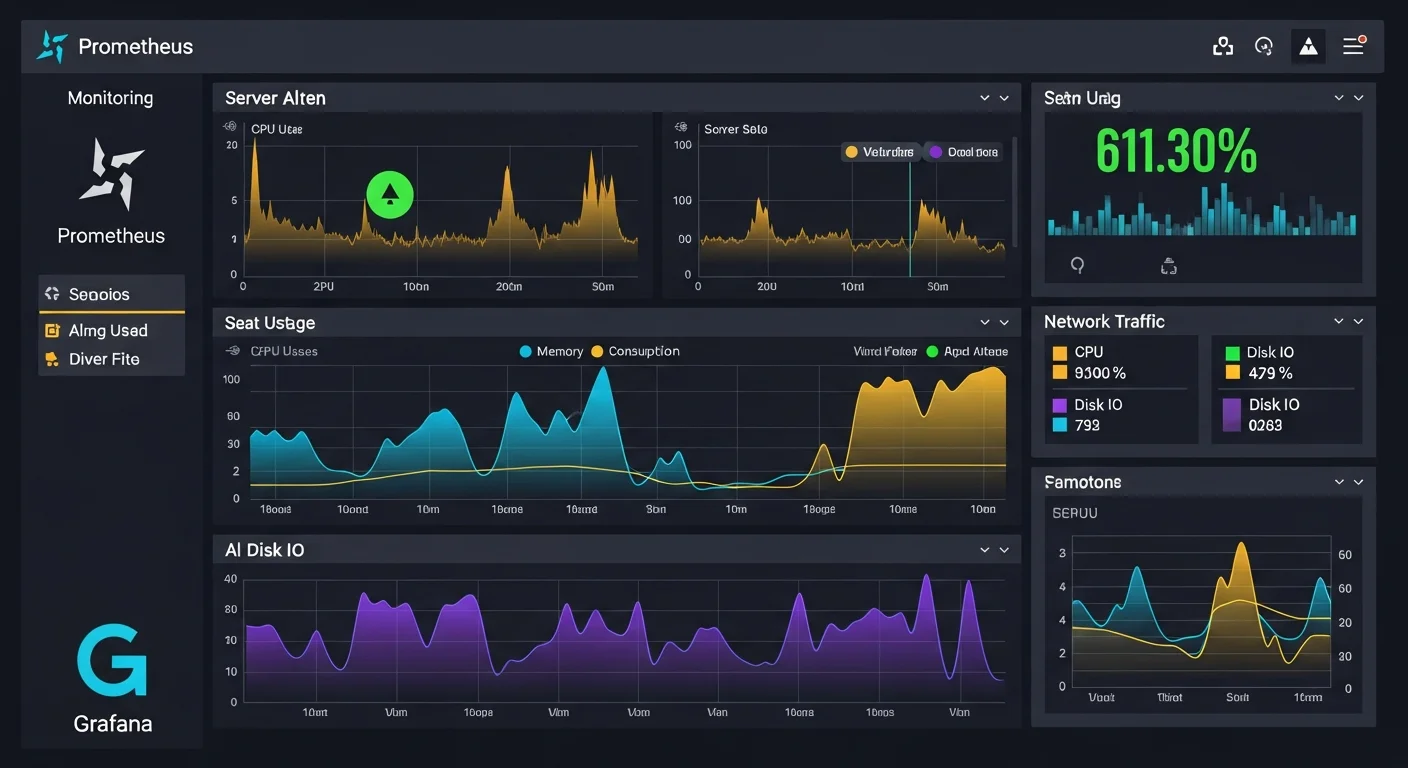
You can't fix what you can't see. Modern infrastructure generates enormous amounts of data—understanding that data is the difference between proactive operations and firefighting. A well-designed monitoring stack provides visibility, enables fast troubleshooting, and prevents outages.
This guide walks you through building a production-ready monitoring solution.
The Modern Monitoring Stack
The industry-standard open-source stack includes:
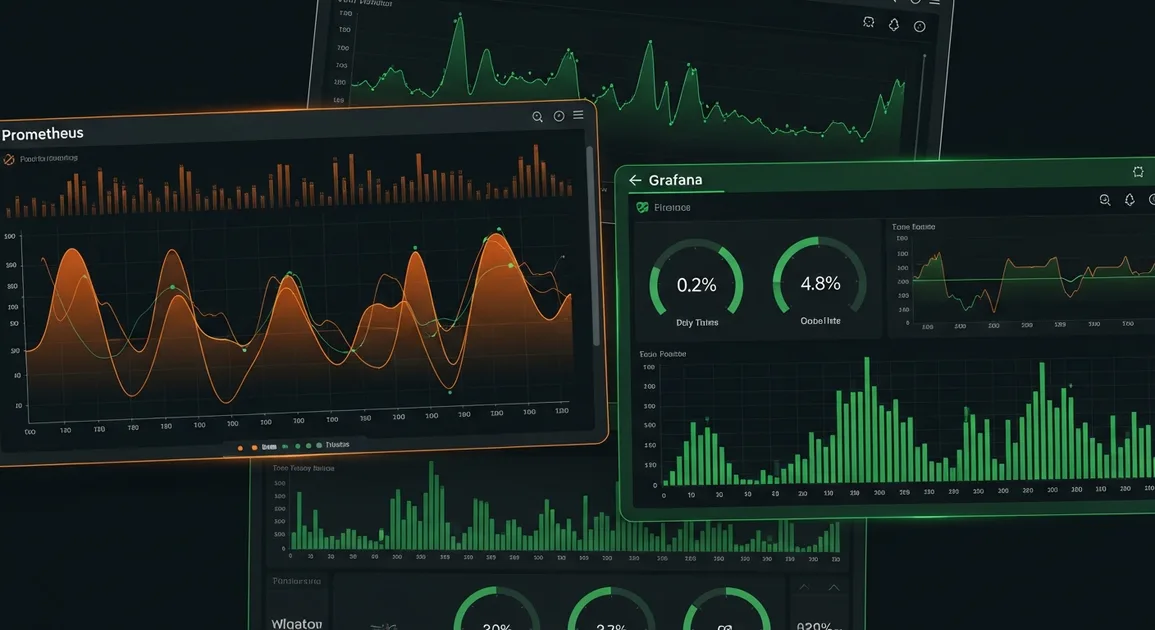
- Prometheus: Metrics collection and storage
- Grafana: Visualization and dashboards
- Alertmanager: Alert routing and notification
- Node Exporter: Host-level metrics
- Various exporters: Application-specific metrics
Installing Prometheus
Docker Compose Setup
version: '3.8'

services:
  prometheus:
    image: prom/prometheus:latest
    ports:
      - "9090:9090"
    volumes:
      - ./prometheus.yml:/etc/prometheus/prometheus.yml
      - prometheus_data:/prometheus
    command:
      - '--config.file=/etc/prometheus/prometheus.yml'
      - '--storage.tsdb.retention.time=30d'

volumes:
  prometheus_data:
Basic Configuration
# prometheus.yml
global:
  scrape_interval: 15s
  evaluation_interval: 15s

scrape_configs:
  - job_name: 'prometheus'
    static_configs:
      - targets: ['localhost:9090']

  - job_name: 'node'
    static_configs:
      - targets: ['node-exporter:9100']
Setting Up Grafana
Docker Configuration
  grafana:
    image: grafana/grafana:latest
    ports:
      - "3000:3000"
    volumes:
      - grafana_data:/var/lib/grafana
    environment:
      - GF_SECURITY_ADMIN_PASSWORD=secure_password
      - GF_USERS_ALLOW_SIGN_UP=false
Creating Dashboards
Start with community dashboards:
- Node Exporter Full: Dashboard ID 1860
- Docker and Host: Dashboard ID 179
- Kubernetes Cluster: Dashboard ID 315
Import via Grafana UI: Dashboards → Import → Enter ID
Essential Exporters
Node Exporter (System Metrics)
  node-exporter:
    image: prom/node-exporter:latest
    ports:
      - "9100:9100"
    volumes:
      - /proc:/host/proc:ro
      - /sys:/host/sys:ro
      - /:/rootfs:ro
    command:
      - '--path.procfs=/host/proc'
      - '--path.sysfs=/host/sys'
PostgreSQL Exporter
  postgres-exporter:
    image: prometheuscommunity/postgres-exporter
    environment:
      DATA_SOURCE_NAME: "postgresql://user:pass@db:5432/dbname?sslmode=disable"
    ports:
      - "9187:9187"
Nginx Exporter
  nginx-exporter:
    image: nginx/nginx-prometheus-exporter
    command:
      - -nginx.scrape-uri=http://nginx:8080/stub_status
    ports:
      - "9113:9113"
Alerting Configuration
Prometheus Alert Rules
# alerts.yml
groups:
  - name: system
    rules:
      - alert: HighCPUUsage
        expr: 100 - (avg by(instance) (rate(node_cpu_seconds_total{mode="idle"}[5m])) * 100) > 80
        for: 5m
        labels:
          severity: warning
        annotations:
          summary: "High CPU usage on {{ $labels.instance }}"
          description: "CPU usage is above 80% for 5 minutes"

      - alert: DiskSpaceLow
        expr: (node_filesystem_avail_bytes / node_filesystem_size_bytes) * 100 < 10
        for: 5m
        labels:
          severity: critical
        annotations:
          summary: "Low disk space on {{ $labels.instance }}"
Alertmanager Configuration
# alertmanager.yml
global:
  smtp_smarthost: 'smtp.example.com:587'
  smtp_from: 'alertmanager@example.com'

route:
  receiver: 'team-email'
  group_wait: 30s
  group_interval: 5m
  repeat_interval: 4h

receivers:
  - name: 'team-email'
    email_configs:
      - to: 'team@example.com'
        send_resolved: true
Key Metrics to Monitor
System Health
- CPU usage, load average
- Memory usage and swap
- Disk I/O and space
- Network traffic and errors
Application Health
Business Metrics
- Transactions per second
- User signups/logins
- Revenue-impacting events
Best Practices
- Use labels effectively: Environment, service, instance
- Set retention appropriately: Balance history vs. storage
- Alert on symptoms, not causes: User impact matters most
- Create runbooks: Document response procedures
- Review alerts regularly: Eliminate noise
Conclusion
A comprehensive monitoring stack is essential for modern operations. Start with the basics, expand coverage gradually, and continuously refine your alerting to minimize noise while catching real issues.
Our monitoring and observability eBooks provide deep dives into building production-ready monitoring solutions.


