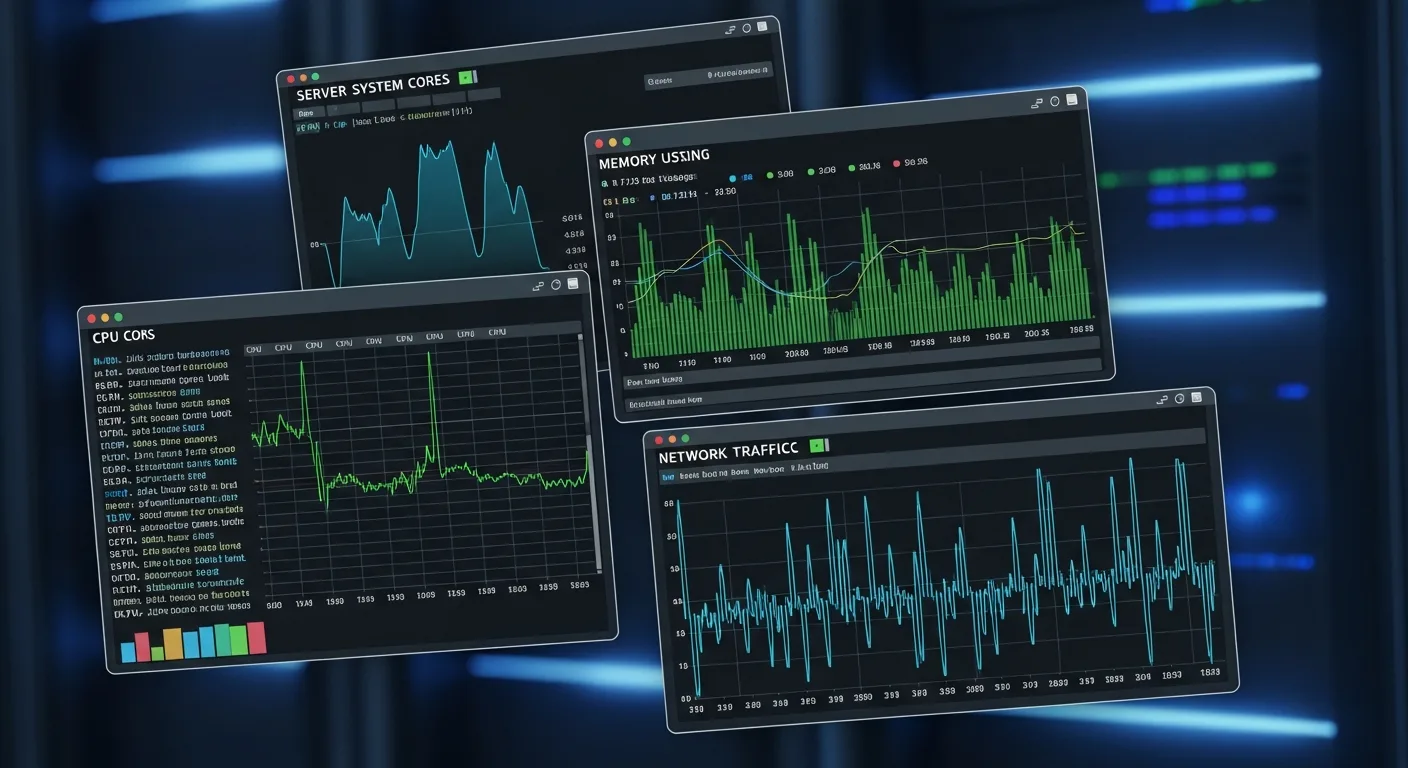
Server monitoring is the backbone of reliable Linux infrastructure. Whether you manage a single VPS or a fleet of cloud instances, knowing what is happening on your servers in real time is the difference between a smooth-running operation and a 3 AM emergency call.
In this guide, we cover the 7 most essential monitoring tools every Linux administrator should have in their toolkit in 2026, with practical examples you can use today.
Why Server Monitoring Matters
Without proper monitoring, problems become invisible until they cause downtime. A slowly filling disk, a memory leak in a background service, or a CPU spike from a runaway process — all of these can be caught early with the right tools.
Good monitoring gives you:
- Proactive alerting — fix problems before users notice
- Capacity planning — know when to scale up
- Performance baselines — understand what "normal" looks like
- Incident investigation — trace root causes quickly
1. htop — Interactive Process Viewer
htop is the improved version of the classic top command. It provides a colorful, interactive view of your system's processes, CPU usage, memory consumption, and load averages.
Key features:
- Color-coded CPU and memory bars per core
- Tree view showing parent-child process relationships
- Search and filter processes by name
- Kill processes directly from the interface
# Install htop
sudo apt install htop    # Debian/Ubuntu
sudo dnf install htop    # RHEL/AlmaLinux

# Run with tree view
htop -t
Pro tip: Press F5 for tree view, F6 to sort by different columns, and F9 to send signals to processes.
2. vmstat — Virtual Memory Statistics
vmstat reports information about processes, memory, paging, block I/O, and CPU activity. It is invaluable for identifying memory pressure and swap usage.
# Report every 2 seconds, 10 times
vmstat 2 10

# Show active/inactive memory
vmstat -a 2 5
Watch the si (swap in) and so (swap out) columns. If these are consistently above zero, your server needs more RAM or you have a memory leak.
3. iostat — Disk I/O Monitoring
Disk performance is often the bottleneck that nobody thinks about until the database slows to a crawl. iostat shows you exactly what your disks are doing.
# Install sysstat package
sudo apt install sysstat

# Extended disk statistics every 3 seconds
iostat -xz 3

# Show only specific devices
iostat -xz sda sdb 2
Key metrics to watch: %util (disk utilization — above 80% means trouble), await (average I/O wait time), and r/s + w/s (reads/writes per second).
4. sar — System Activity Reporter
sar is the Swiss Army knife of Linux monitoring. Part of the sysstat package, it collects and reports system activity data over time, making it perfect for historical analysis.
# CPU usage for today
sar -u

# Memory usage every 5 seconds, 12 times
sar -r 5 12

# Network statistics
sar -n DEV 3 10

# Historical data from yesterday
sar -u -f /var/log/sysstat/sa$(date -d yesterday +%d)
Setting up sysstat to collect data every 10 minutes via cron gives you valuable historical trends for capacity planning.
📚 Recommended Reading
Master performance analysis and system optimization with our comprehensive guide:
Linux Performance Tuning — €12.90
Covers CPU scheduling, memory management, I/O optimization, kernel parameters, and real-world tuning scenarios. Get your copy →
5. journalctl — Systemd Log Analysis
Modern Linux distributions use systemd for service management, and journalctl is your gateway to all system logs. It replaces the need to manually grep through /var/log files.
# Follow logs in real time (like tail -f)
journalctl -f

# Show logs from specific service
journalctl -u nginx.service --since "1 hour ago"

# Show only errors and critical messages
journalctl -p err -b

# Show disk usage of journal
journalctl --disk-usage

# Show logs between specific times
journalctl --since "2026-02-15 09:00" --until "2026-02-15 12:00"
Pro tip: Combine with grep for powerful filtering: journalctl -u php-fpm | grep "FATAL"
6. Netdata — Real-Time Monitoring Dashboard
For those who prefer a visual approach, Netdata provides an incredibly detailed web-based dashboard with thousands of metrics, auto-detected and displayed in real time.
# One-line installation
bash <(curl -Ss https://my-netdata.io/kickstart.sh)

# Access dashboard at
# http://your-server:19999
Netdata monitors CPU, memory, disk, network, processes, applications, containers, and much more — all with zero configuration. It also includes built-in alerting.
7. Prometheus + Grafana — Enterprise-Grade Monitoring
For production environments with multiple servers, the Prometheus + Grafana stack is the industry standard. Prometheus collects time-series metrics, and Grafana creates beautiful, customizable dashboards.
Architecture:
- node_exporter — runs on each server, exposes system metrics
- Prometheus — scrapes and stores metrics centrally
- Grafana — visualizes metrics and manages alerts
- Alertmanager — routes notifications (email, Slack, PagerDuty)
This stack scales from a handful of servers to thousands, and the community provides ready-made dashboards for every use case.
📚 Go Deeper
Build your administration skills from the ground up:
- Linux System Administration Handbook — €13.90 — Complete reference for professional admins
- Linux Troubleshooting Techniques — €11.90 — Systematic approach to diagnosing issues
- Linux System Administration Masterclass — €16.90 — Advanced topics for experienced admins
Building a Monitoring Strategy
Tools alone are not enough. Here is a practical monitoring strategy:
- Start with the basics: Install
htop,sysstat, and learnjournalctlon every server - Set up dashboards: Deploy Netdata for quick wins, or Prometheus + Grafana for multi-server environments
- Define thresholds: CPU > 85% for 5 minutes, disk > 90%, memory > 90%, swap usage > 0
- Configure alerts: Email for warnings, SMS/Slack for critical issues
- Review weekly: Look at trends, not just current values
Quick Reference Cheat Sheet
| Task | Command |
|---|---|
| Top CPU processes | ps aux --sort=-%cpu | head -10 |
| Top memory processes | ps aux --sort=-%mem | head -10 |
| Disk usage summary | df -h |
| Large files | du -sh /* | sort -rh | head |
| Open network connections | ss -tunap |
| Failed services | systemctl --failed |
| Last logins | last -n 20 |
Conclusion
Effective server monitoring is not about having the most advanced tools — it is about consistently watching the right metrics and acting on them before problems escalate. Start with the command-line tools you already have, build up to dashboards and alerting, and you will sleep much better at night knowing your servers are under control.
The tools in this guide give you everything you need, from quick interactive checks with htop to enterprise-grade monitoring with Prometheus. Choose the right level for your infrastructure and grow from there.


