Introduction to Network Packet Analysis
Network troubleshooting is an essential skill for every IT professional. When applications fail to connect, performance degrades, or security incidents occur, the ability to analyze network traffic becomes invaluable. Wireshark is the industry-standard tool for packet capture and analysis, and this guide will teach you how to use it effectively.
Understanding Wireshark Fundamentals
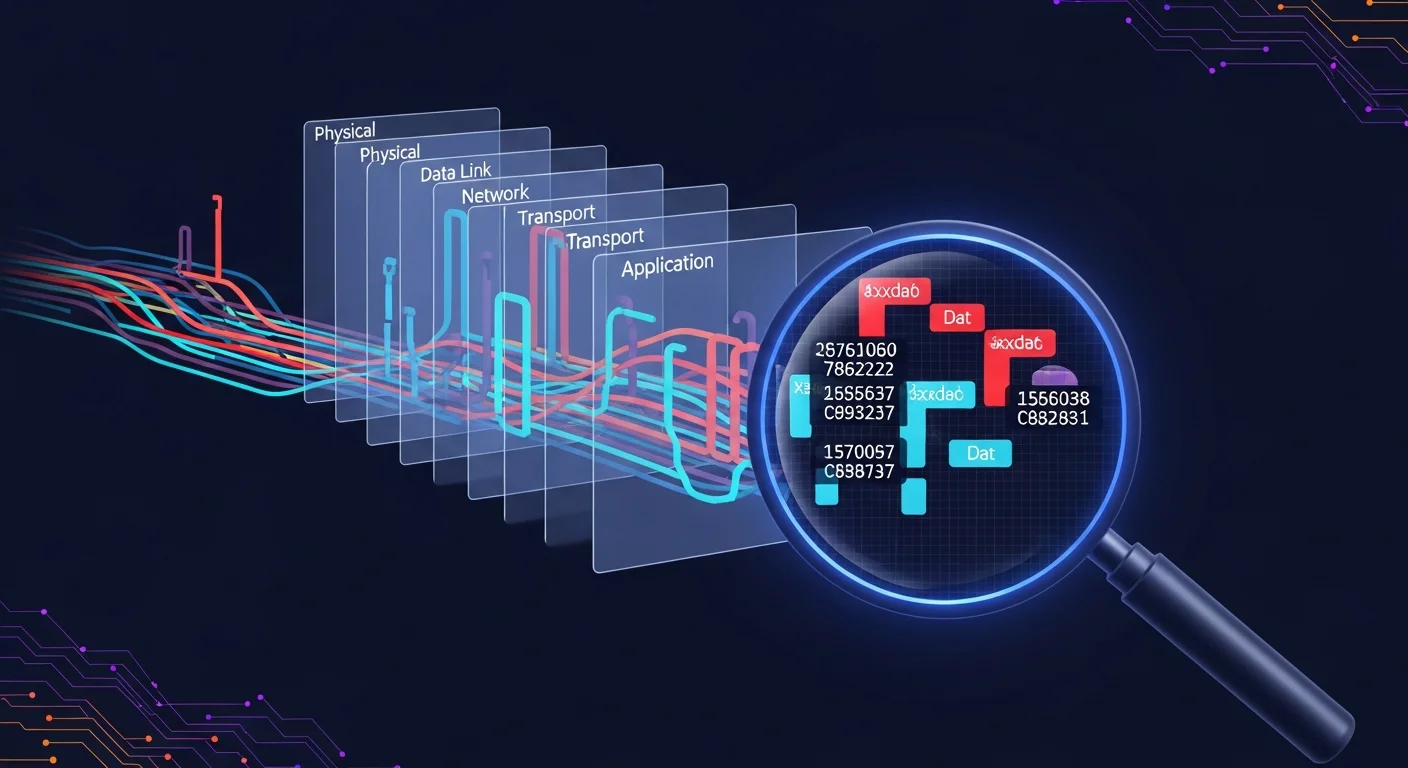
Wireshark captures network packets in real-time and provides detailed protocol analysis. Key concepts include:
- Packet Capture: Recording network traffic passing through an interface
- Protocol Dissection: Breaking down packets into their component layers
- Filtering: Isolating specific traffic for analysis
- Statistics: Aggregating data for pattern recognition
Setting Up Wireshark for Capture
Before capturing traffic, configure your environment correctly:
Interface Selection: Choose the correct network interface. For troubleshooting local issues, select your primary network adapter. For monitoring all traffic, you may need a mirror port or TAP device.
Capture Filters: Use capture filters to reduce data volume:
# Capture only traffic to/from specific host
host 192.168.1.100

# Capture only web traffic
port 80 or port 443

# Capture traffic on subnet
net 10.0.0.0/24

# Capture only TCP traffic
tcp
Display Filters: The Key to Efficient Analysis
Display filters help you find relevant packets in large captures:
# Filter by IP address
ip.addr == 192.168.1.100
ip.src == 10.0.0.1
ip.dst == 8.8.8.8

# Filter by protocol
http
dns
tcp
udp
tls

# Filter by port
tcp.port == 443
tcp.dstport == 22

# HTTP specific filters
http.request.method == "POST"
http.response.code == 404
http.host contains "api.example.com"

# Combine filters
ip.addr == 192.168.1.100 and tcp.port == 80
(http or dns) and ip.addr == 10.0.0.50
Analyzing the TCP Three-Way Handshake
Understanding TCP connections is fundamental to network troubleshooting:
- SYN: Client initiates connection (flags: SYN)
- SYN-ACK: Server acknowledges and responds (flags: SYN, ACK)
- ACK: Client confirms connection established (flags: ACK)
To filter handshakes in Wireshark:
# Show only SYN packets (connection attempts)
tcp.flags.syn == 1 and tcp.flags.ack == 0

# Show SYN-ACK responses
tcp.flags.syn == 1 and tcp.flags.ack == 1

# Show connection resets (problems)
tcp.flags.reset == 1
Troubleshooting DNS Issues
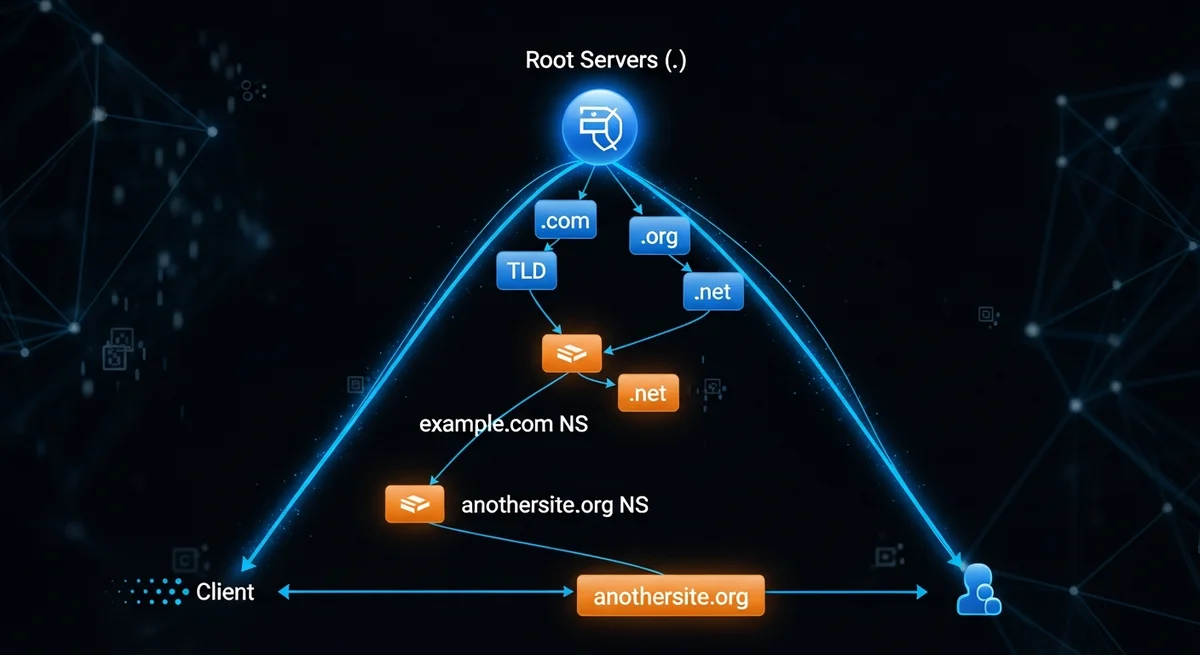
DNS problems are among the most common network issues. Use Wireshark to analyze DNS queries and responses:
# All DNS traffic
dns

# DNS queries only
dns.flags.response == 0

# DNS responses only
dns.flags.response == 1

# Failed DNS queries (NXDOMAIN)
dns.flags.rcode == 3

# Queries for specific domain
dns.qry.name contains "example.com"
Common DNS issues to look for:
- No response to DNS queries (network/firewall issue)
- NXDOMAIN responses (domain does not exist)
- SERVFAIL responses (DNS server error)
- High latency in DNS responses
HTTP and HTTPS Troubleshooting
For HTTP traffic, Wireshark provides detailed request/response analysis:
# HTTP requests
http.request

# HTTP responses
http.response

# Specific HTTP methods
http.request.method == "GET"
http.request.method == "POST"

# Error responses
http.response.code >= 400
http.response.code == 500
For HTTPS, you can only see the TLS handshake unless you have the private key or use a proxy. Look for TLS version and cipher information:
# TLS handshakes
tls.handshake.type == 1  # Client Hello
tls.handshake.type == 2  # Server Hello

# TLS version issues
tls.record.version
Identifying Network Latency
Wireshark helps identify latency sources:
- Enable time delta columns: Edit → Preferences → Columns → Add "Delta time"
- Sort by delta time to find slow packets
- Look for TCP retransmissions:
tcp.analysis.retransmission - Check round-trip time: Statistics → TCP Stream Graphs → Round Trip Time
# TCP retransmissions
tcp.analysis.retransmission

# Duplicate ACKs (possible packet loss)
tcp.analysis.duplicate_ack

# Zero window (receiver buffer full)
tcp.analysis.zero_window
Real-World Troubleshooting Scenarios
Scenario 1: Application Cannot Connect
- Capture traffic while reproducing the issue
- Filter for the destination IP:
ip.dst == target_ip - Look for SYN packets without SYN-ACK responses (firewall blocking)
- Check for RST packets (port closed or connection refused)
Scenario 2: Slow Application Performance
- Capture a session from start to finish
- Check for retransmissions:
tcp.analysis.retransmission - Analyze time deltas between requests and responses
- Look for TCP window size issues
Scenario 3: Intermittent Connectivity
- Run a continuous capture during problem periods
- Look for patterns in connection resets
- Check for duplicate IP addresses (ARP conflicts)
- Monitor ICMP for network unreachable messages
Using Statistics for Analysis
Wireshark provides powerful statistical tools:
- Protocol Hierarchy: Overview of traffic composition
- Conversations: See all communication pairs
- Endpoints: Identify most active hosts
- IO Graphs: Visualize traffic patterns over time
- Expert Information: Automatic problem detection
Command-Line Alternatives: tshark
For server environments without GUI, use tshark:
# Capture to file
tshark -i eth0 -w capture.pcap

# Read and filter capture file
tshark -r capture.pcap -Y "http.request"

# Extract specific fields
tshark -r capture.pcap -T fields -e ip.src -e ip.dst -e http.host

# Live statistics
tshark -i eth0 -q -z conv,tcp
Best Practices for Packet Analysis
- Capture at the right location: As close to the problem source as possible
- Use capture filters: Reduce data volume for large-scale captures
- Document your findings: Add comments to important packets
- Compare baseline captures: Know what normal looks like
- Secure your captures: Packet captures may contain sensitive data
Conclusion
Wireshark is an indispensable tool for network troubleshooting. By mastering display filters, understanding protocol behavior, and knowing where to look for common issues, you can quickly diagnose and resolve network problems. Practice regularly with different scenarios to build your packet analysis skills.
Ready to deepen your networking knowledge? Check out our comprehensive collection of networking and security books to become a network troubleshooting expert.


