Network issues are among the most frustrating problems a Linux administrator faces. The symptoms are often vague — "the server is slow," "I can't connect," "the website times out" — and the root cause can be anywhere between the application layer and the physical cable.
This guide gives you a systematic troubleshooting methodology and the essential tools to diagnose and fix any network problem efficiently.
The OSI Model Troubleshooting Approach
The most effective way to troubleshoot network issues is to work through the layers systematically, from the bottom up:
- Physical / Link Layer: Is the cable plugged in? Is the interface up?
- Network Layer: Do we have an IP address? Can we reach the gateway?
- Transport Layer: Is the port open? Is the service listening?
- Application Layer: Is the application responding correctly?
By following this order, you avoid wasting time debugging application configuration when the problem is actually a misconfigured firewall rule at layer 3.
Step 1: Check Interface Status
Before anything else, verify that your network interfaces are up and configured correctly.
# Show all interfaces with IP addresses
ip addr show

# Check if interface is up
ip link show eth0

# Show routing table
ip route show

# Check default gateway
ip route | grep default

# Quick interface statistics
ip -s link show eth0
What to look for:
- State should be
UP— if it saysDOWN, the interface is not active - An IPv4 address should be assigned (unless using IPv6 only)
- A default gateway should be present
- Check for excessive errors or dropped packets in statistics
Step 2: Test Basic Connectivity
ping is still the first tool you should reach for. It tests basic IP connectivity and gives you round-trip time (latency) measurements.
# Ping the default gateway
ping -c 4 $(ip route | grep default | awk '{print $3}')

# Ping an external DNS server
ping -c 4 8.8.8.8

# Ping a hostname (tests DNS too)
ping -c 4 google.com

# Ping with specific packet size (test MTU)
ping -c 4 -s 1472 -M do 8.8.8.8
Interpretation:
- Gateway ping fails → Layer 2/3 problem (check cables, IP config, VLAN)
- External IP works, hostname fails → DNS problem
- High latency / packet loss → Network congestion or routing issue
- Large packet ping fails → MTU mismatch
Step 3: Trace the Route
traceroute (or mtr) shows you the path packets take to reach a destination, revealing where delays or drops occur.
# Traditional traceroute
traceroute google.com

# MTR - combines ping + traceroute in real time
mtr google.com

# TCP traceroute (bypasses ICMP-blocking firewalls)
traceroute -T -p 443 example.com

# MTR with report mode (send 100 packets)
mtr -rw -c 100 google.com
mtr is particularly powerful because it continuously sends packets and shows you loss percentage and jitter at each hop. Run it for at least 30 seconds to get meaningful data.
📚 Recommended Reading
Master Linux networking from the ground up:
- Linux Networking Fundamentals — €9.90 — Complete networking foundations for admins
- Linux IPv4: The Complete Guide — €24.90 — Deep dive into IPv4 networking on Linux
- Linux IPv6: The Complete Guide — €29.90 — Future-proof your networking skills
Step 4: DNS Troubleshooting
DNS problems are responsible for a surprising number of "network" issues. If ping 8.8.8.8 works but ping google.com fails, DNS is your culprit.
# Query DNS with dig
dig example.com

# Query specific DNS server
dig @8.8.8.8 example.com

# Trace DNS delegation chain
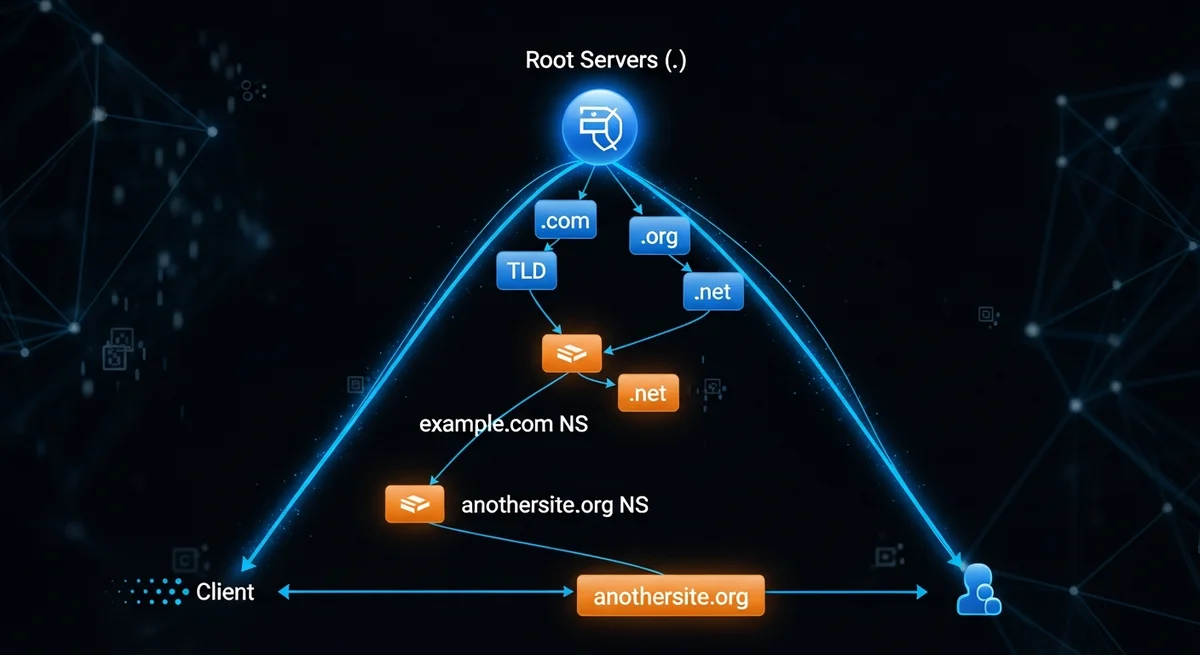
dig +trace example.com

# Reverse DNS lookup
dig -x 93.184.216.34

# Check all record types
dig example.com ANY

# Check MX records
dig example.com MX

# Simple lookup with host
host example.com

# Check /etc/resolv.conf
cat /etc/resolv.conf

# Check systemd-resolved status
resolvectl status
Common DNS issues:
- Wrong nameserver in
/etc/resolv.conf systemd-resolvedconflicts with manual DNS settings- DNS TTL caching showing stale records
- Missing reverse DNS causing mail delivery failures
Step 5: Check Ports and Services
If connectivity works but the application is unreachable, check whether the service is actually listening on the expected port.
# Show all listening ports and their processes
ss -tlnp

# Show established connections
ss -tnp

# Check if a specific port is listening
ss -tlnp | grep :443

# Test if a remote port is open
nc -zv example.com 443

# Detailed connection to remote port
curl -v https://example.com 2>&1 | head -20

# Check connection count per state
ss -s
Common findings:
- Service listening on
127.0.0.1instead of0.0.0.0→ Only accessible locally - Port not in listening state → Service crashed or configuration error
- Many connections in
TIME_WAIT→ Connection recycling issues - Many connections in
CLOSE_WAIT→ Application not closing connections properly
Step 6: Firewall Analysis
Firewalls are a frequent source of "silent" connection failures where packets simply disappear without any error message.
# List all iptables rules with line numbers
sudo iptables -L -n -v --line-numbers

# List nftables rules (modern systems)
sudo nft list ruleset

# Check firewalld zones and rules
sudo firewall-cmd --list-all

# Check specific chain
sudo iptables -L INPUT -n -v

# Watch firewall drops in real time
sudo watch -n 1 'iptables -L -n -v | grep DROP'

# Temporarily disable firewalld for testing
sudo systemctl stop firewalld    # DON'T forget to re-enable!
📚 Deep Dive into Firewalls & Security
Understand firewall configuration inside and out:
- Linux Firewall Configuration — €12.90 — iptables, nftables, and firewalld mastery
- Linux Security Essentials — €9.90 — Foundational security for every admin
- Linux DNS & DHCP Services — €12.90 — Build and troubleshoot DNS infrastructure
Step 7: Packet Capture with tcpdump
When all else fails, tcpdump shows you exactly what is happening on the wire. This is the ultimate diagnostic tool for network problems.
# Capture all traffic on eth0
sudo tcpdump -i eth0 -c 100

# Capture traffic to/from specific host
sudo tcpdump -i eth0 host 192.168.1.100

# Capture only HTTP traffic
sudo tcpdump -i eth0 port 80 or port 443

# Capture DNS queries
sudo tcpdump -i eth0 port 53

# Save capture to file for Wireshark analysis
sudo tcpdump -i eth0 -w /tmp/capture.pcap -c 1000

# Capture with human-readable output
sudo tcpdump -i eth0 -A port 80 | head -50

# Capture SYN packets only (connection attempts)
sudo tcpdump -i eth0 'tcp[tcpflags] & tcp-syn != 0'
tcpdump output tells you whether packets are arriving, whether connections are being established (SYN → SYN-ACK → ACK), and whether data is flowing in both directions.
Quick Diagnostic Flowchart
| Symptom | First Check | Likely Cause |
|---|---|---|
| Cannot ping gateway | ip addr, ip link | Interface down, wrong IP, cable issue |
| Ping IP works, name fails | dig, /etc/resolv.conf | DNS misconfiguration |
| Connection refused | ss -tlnp | Service not running or wrong port |
| Connection timeout | iptables -L, traceroute | Firewall blocking or routing issue |
| Slow connections | mtr, ss -s | Network congestion, too many connections |
| Intermittent issues | mtr -c 200 | Packet loss at specific hop |
Network Performance Testing
Sometimes the network works but is slower than expected. Use these tools to measure actual performance:
# Install iperf3 for bandwidth testing
sudo apt install iperf3

# Server side
iperf3 -s

# Client side (test upload speed)
iperf3 -c server-ip

# Test download speed
iperf3 -c server-ip -R

# Test with multiple parallel streams
iperf3 -c server-ip -P 4

# Quick internet speed test
curl -o /dev/null -w "Speed: %{speed_download} bytes/sec\n" https://speed.hetzner.de/100MB.bin
📚 Complete Your Skillset
From troubleshooting to mastery:
- Linux Troubleshooting Techniques — €11.90 — Systematic diagnostic methodology
- Linux Command Line Mastery — €8.90 — Essential tools every admin needs
- Linux Performance Tuning — €12.90 — Optimize system and network performance
Conclusion
Network troubleshooting is a skill that improves dramatically with practice and a systematic approach. By working through the layers — interface, connectivity, DNS, ports, firewall, and finally packet capture — you can methodically isolate and fix any network problem.
The key takeaway: never guess. Each tool in this guide gives you concrete data. Follow the evidence, test one variable at a time, and document what you find. Over time, you will develop an intuition for common patterns, but the systematic approach remains your most reliable method.


