Why PostgreSQL Performance Tuning Matters More Than Ever in 2026
PostgreSQL has become the world's most popular open-source relational database, surpassing MySQL in developer surveys for the third consecutive year. Companies like Apple, Instagram, Spotify, and the US Federal Aviation Administration trust PostgreSQL with their most critical data. But running PostgreSQL and running it well are two very different things.
A default PostgreSQL installation is configured conservatively — designed to run on minimal hardware without crashing. For production workloads, these defaults leave massive performance on the table. A properly tuned PostgreSQL instance can handle 10-50x more throughput than an untuned one on the same hardware.
This guide covers the essential performance tuning techniques every database administrator and developer should know, from configuration parameters to query optimization and indexing strategies.
Production Reality: According to Percona's 2025 Open Source Database Survey, 68% of PostgreSQL performance issues are caused by missing indexes or poorly written queries — not hardware limitations. Tuning your queries and indexes will almost always give you more improvement than upgrading your server.
PostgreSQL Query Execution Pipeline
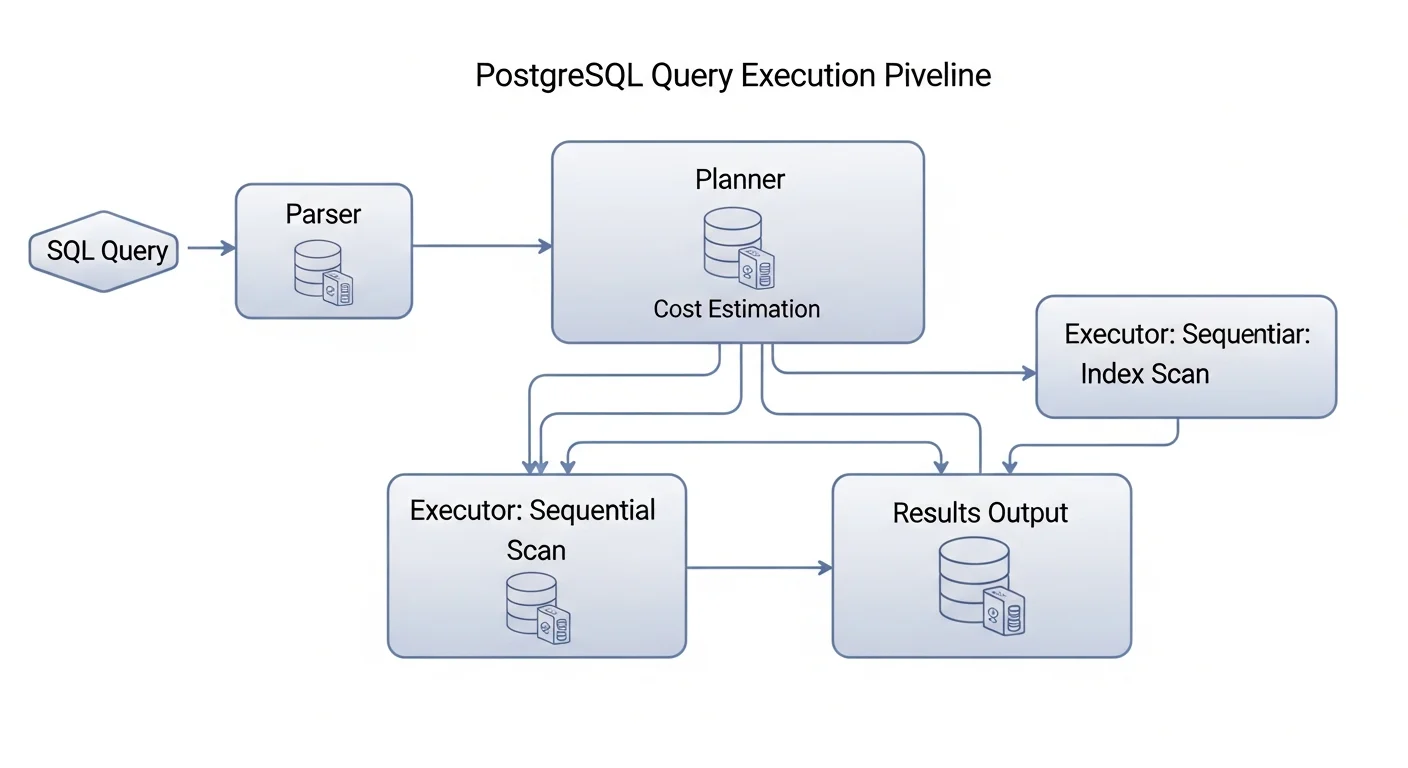
Before you can optimize queries, you need to understand how PostgreSQL processes them. Every SQL query goes through these stages:
- Parser — Checks SQL syntax and converts the query text into a parse tree
- Analyzer — Resolves table and column references, checks permissions
- Rewriter — Applies any rules (e.g., views are expanded here)
- Planner/Optimizer — The brain of PostgreSQL. Generates multiple possible execution plans, estimates the cost of each, and chooses the cheapest one
- Executor — Executes the chosen plan and returns results
The planner is where the magic (and the problems) happen. It uses table statistics to estimate how many rows each operation will produce and how expensive different access methods will be. When statistics are outdated or missing, the planner makes bad decisions.
Source: PostgreSQL Documentation — The Path of a Query
Essential postgresql.conf Tuning Parameters
Memory Configuration
The most impactful performance settings are memory-related. Here are the critical parameters for a dedicated database server with 32GB RAM:
# postgresql.conf — Memory Settings for 32GB Server

# Shared buffer cache — typically 25% of total RAM
shared_buffers = 8GB

# Working memory per query operation (sorts, joins, etc.)
work_mem = 256MB

# Memory for maintenance operations (VACUUM, CREATE INDEX, etc.)
maintenance_work_mem = 2GB

# Effective cache size — how much memory is available for disk caching
effective_cache_size = 24GB
WAL and I/O Configuration
# WAL Settings for Production
wal_buffers = 64MB
min_wal_size = 1GB
max_wal_size = 4GB
checkpoint_completion_target = 0.9

# For SSD storage
random_page_cost = 1.1
effective_io_concurrency = 200| Parameter | Default | Recommended (32GB) | Impact |
|---|---|---|---|
| shared_buffers | 128MB | 8GB | Critical — biggest single improvement |
| work_mem | 4MB | 64-256MB | High — affects sorts and joins |
| effective_cache_size | 4GB | 24GB | High — helps planner choose index scans |
| random_page_cost | 4.0 | 1.1 (SSD) | High — wrong value causes seq scans |
| maintenance_work_mem | 64MB | 2GB | Medium — speeds up VACUUM and indexing |
| checkpoint_completion_target | 0.9 | 0.9 | Medium — spreads checkpoint I/O |
Source: PostgreSQL Docs — Resource Consumption | PGTune — Configuration Calculator
Mastering EXPLAIN ANALYZE
EXPLAIN ANALYZE is the single most important tool for query optimization. It shows you exactly what PostgreSQL does when executing a query.
EXPLAIN (ANALYZE, BUFFERS, FORMAT TEXT)
SELECT o.id, o.total, c.email
FROM orders o
JOIN customers c ON c.id = o.customer_id
WHERE o.created_at > NOW() - INTERVAL '30 days'
  AND o.total > 100
ORDER BY o.created_at DESC
LIMIT 20;
Reading EXPLAIN Output
| Node Type | What It Means | Watch For |
|---|---|---|
| Seq Scan | Full table scan (reads every row) | On large tables = needs index |
| Index Scan | Uses index to find rows | Good for selective queries |
| Index Only Scan | All data from index | Best possible — covering index |
| Bitmap Heap Scan | Index bitmap then table read | Good for medium selectivity |
| Hash Join | Hash table for join | Good for equality joins |
| Nested Loop | For each outer row, scan inner | Great for small sets, bad for large |
| Sort | In-memory or disk sort | Watch for disk sorts |
Source: PostgreSQL Docs — Using EXPLAIN | explain.depesz.com — Visual EXPLAIN Analyzer
Indexing Strategies That Actually Work
-- Composite index — column order matters!
CREATE INDEX idx_orders_cust_date ON orders (customer_id, created_at DESC);

-- Covering index — avoids table lookups
CREATE INDEX idx_orders_covering ON orders (customer_id, created_at DESC)
    INCLUDE (total, status);

-- Partial index — only index rows that matter
CREATE INDEX idx_orders_pending ON orders (created_at)
    WHERE status = 'pending';

-- GIN index for full-text search
CREATE INDEX idx_books_search ON books
    USING GIN (to_tsvector('english', title || ' ' || description));

-- BRIN index for time-series data (tiny, fast)
CREATE INDEX idx_logs_ts ON application_logs USING BRIN (created_at);
-- Find unused indexes wasting space
SELECT indexname, idx_scan, pg_size_pretty(pg_relation_size(indexrelid))
FROM pg_stat_user_indexes WHERE idx_scan = 0
ORDER BY pg_relation_size(indexrelid) DESC;
-- Find tables needing indexes (too many seq scans)
SELECT relname, seq_scan, idx_scan,
ROUND(100.0 * idx_scan / NULLIF(seq_scan + idx_scan, 0), 1) AS idx_pct
FROM pg_stat_user_tables WHERE seq_scan > 1000
ORDER BY seq_scan DESC LIMIT 20;Source: PostgreSQL Docs — Indexes
VACUUM and Autovacuum Tuning
PostgreSQL MVCC means UPDATE and DELETE do not remove old rows immediately. VACUUM reclaims dead space. If it falls behind, table bloat grows and queries slow down.
# Autovacuum settings for production
autovacuum_vacuum_scale_factor = 0.05
autovacuum_analyze_scale_factor = 0.025
autovacuum_max_workers = 4
autovacuum_naptime = 30s
Query Optimization Patterns
-- BAD: Function on indexed column
SELECT * FROM users WHERE EXTRACT(YEAR FROM created_at) = 2026;
-- GOOD: Use range comparison
SELECT * FROM users WHERE created_at >= '2026-01-01' AND created_at < '2027-01-01';

-- BAD: SELECT * when you only need a few columns
SELECT * FROM orders WHERE customer_id = 42;
-- GOOD: Select only what you need
SELECT id, total, status FROM orders WHERE customer_id = 42;
Monitoring PostgreSQL Performance
-- Enable pg_stat_statements for query tracking
CREATE EXTENSION IF NOT EXISTS pg_stat_statements;

-- Top 10 slowest queries
SELECT query, calls, total_exec_time / 1000 AS total_sec,
       mean_exec_time AS avg_ms
FROM pg_stat_statements ORDER BY total_exec_time DESC LIMIT 10;

-- Cache hit ratio (should be > 99%)
SELECT ROUND(100.0 * sum(blks_hit) / NULLIF(sum(blks_hit + blks_read), 0), 2)
    AS cache_hit_ratio FROM pg_stat_database;
Performance Tuning Checklist
| Priority | Action | Expected Impact |
|---|---|---|
| Critical | Tune shared_buffers, work_mem, effective_cache_size | 2-10x improvement |
| Critical | Set random_page_cost = 1.1 for SSD | Enables index scan selection |
| Critical | Add indexes for filtered/joined columns | 100-1000x for queries |
| High | Enable pg_stat_statements and monitor | Identifies targets |
| High | Tune autovacuum for busy tables | Prevents bloat |
| Medium | Use connection pooling (PgBouncer) | More concurrent users |
| Medium | Implement covering indexes | Eliminates table lookups |