When a Linux system boots, hundreds of events happen in rapid succession: firmware initialization, bootloader execution, kernel loading, hardware detection, filesystem mounts, service startup, and network configuration. Understanding how to log and analyze the boot process is one of the most critical skills for any Linux administrator. Whether you are troubleshooting a server that will not start, optimizing boot times, or auditing system security, boot logs tell the full story.
This guide covers every tool and technique you need to capture, persist, analyze, and troubleshoot Linux boot logs in 2026.

Understanding the Linux Boot Process
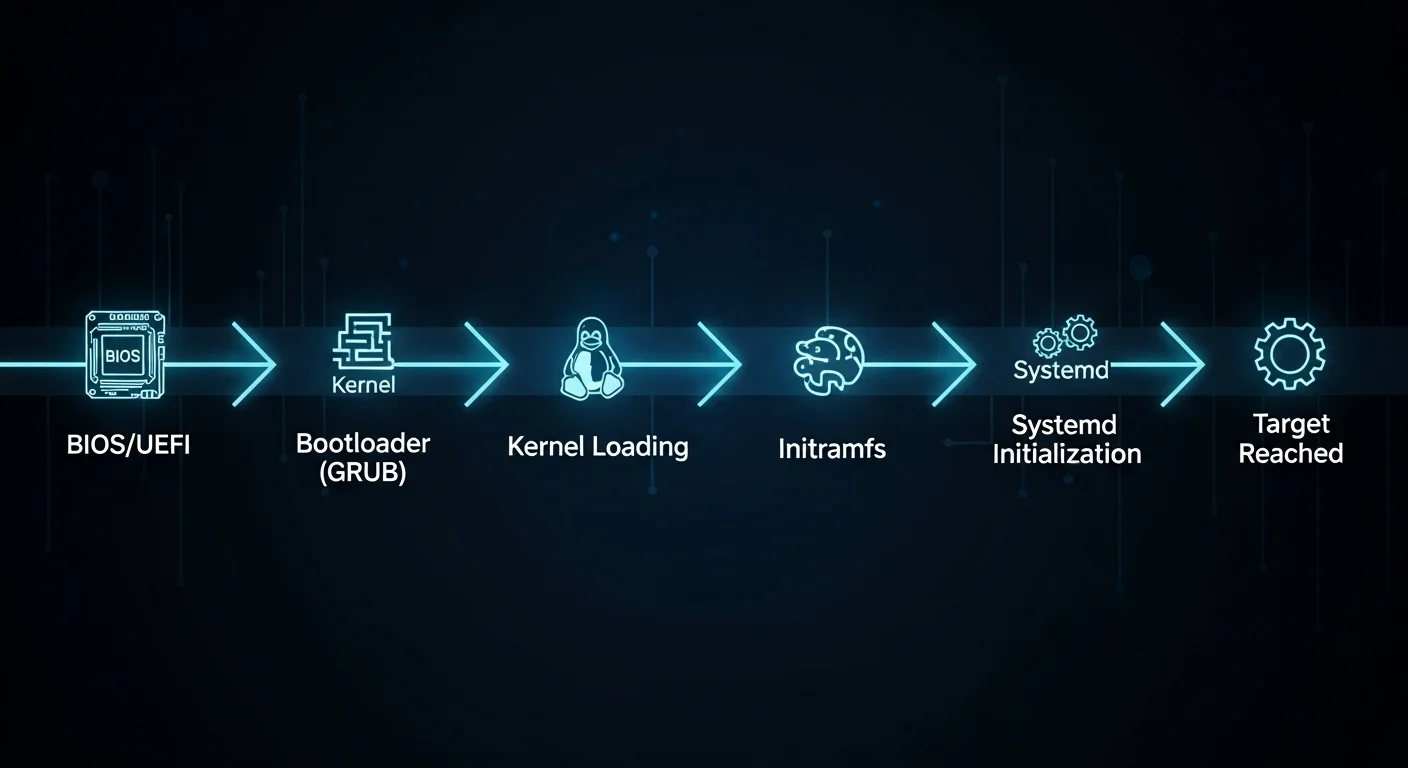
Before diving into logging, it is essential to understand what happens during boot. The Linux boot process follows a well-defined sequence of stages, and each stage generates different types of log data:
- BIOS/UEFI Firmware -- Hardware initialization, POST (Power-On Self-Test), boot device selection
- Bootloader (GRUB2) -- Loads the kernel and initial RAM disk (initramfs) into memory
- Kernel Initialization -- Hardware detection, driver loading, memory management setup
- initramfs/initrd -- Early userspace: loads essential drivers, finds root filesystem
- systemd (PID 1) -- System and service manager takes over, mounts filesystems, starts services
- Target Reached -- multi-user.target or graphical.target reached, login prompt available
Each of these stages can be logged and analyzed using different tools. The kernel ring buffer (dmesg) captures stages 3-4, while the systemd journal (journalctl) captures stages 5-6 and can also include kernel messages.
Method 1: dmesg -- The Kernel Ring Buffer
dmesg (diagnostic message) displays messages from the kernel ring buffer. This is the oldest and most fundamental boot logging tool in Linux. It captures everything the kernel reports during boot: hardware detection, driver loading, filesystem mounting, and error messages.
Basic dmesg Usage
# Display all kernel messages
dmesg

# Display with human-readable timestamps
dmesg -T

# Display with ISO 8601 timestamps
dmesg --time-format=iso

# Follow new messages in real-time (like tail -f)
dmesg -w

# Show only the last 50 lines
dmesg | tail -50
Filtering dmesg by Priority Level
Kernel messages have priority levels from 0 (emergency) to 7 (debug). Filtering by level helps you focus on problems:
# Show only errors and above (emerg, alert, crit, err)
dmesg --level=err

# Show warnings and errors
dmesg --level=warn,err

# Show only critical and emergency messages
dmesg --level=emerg,alert,crit

# Show all levels with color coding
dmesg -L
The priority levels are:
| Level | Name | Description |
|---|---|---|
| 0 | emerg | System is unusable |
| 1 | alert | Immediate action required |
| 2 | crit | Critical conditions |
| 3 | err | Error conditions |
| 4 | warn | Warning conditions |
| 5 | notice | Normal but significant |
| 6 | info | Informational |
| 7 | debug | Debug-level messages |
Filtering dmesg by Facility
# Show only kernel messages
dmesg --facility=kern

# Show only user-space messages
dmesg --facility=user

# Show hardware/device related messages
dmesg | grep -i "usb\|pci\|scsi\|ata\|nvme"

# Show network-related boot messages
dmesg | grep -i "eth\|wlan\|wifi\|net\|link"

# Show disk/storage messages
dmesg | grep -i "sd[a-z]\|nvme\|disk\|partition\|mount"
Saving dmesg Output
# Save complete dmesg to file
dmesg -T > /var/log/dmesg-$(date +%Y%m%d-%H%M%S).log

# Save only errors
dmesg --level=err,crit,alert,emerg -T > /var/log/boot-errors.log

# Clear the kernel ring buffer (requires root)
sudo dmesg -C
Method 2: journalctl -- The systemd Journal
journalctl is the modern, comprehensive logging tool provided by systemd. It captures everything: kernel messages, service output, user session events, and more. For boot logging, it is the most powerful tool available.
Viewing Boot Logs
# Show logs from the current boot
journalctl -b

# Show logs from the current boot (short format)
journalctl -b --no-pager

# Show logs from the previous boot
journalctl -b -1

# Show logs from two boots ago
journalctl -b -2

# List all available boots
journalctl --list-boots
The --list-boots command is particularly useful. It shows every boot session with its ID, timestamp, and index number:
$ journalctl --list-boots
-3 abc123def456 Wed 2026-03-15 08:12:01 CET - Wed 2026-03-15 18:45:33 CET
-2 fed789abc012 Thu 2026-03-16 07:55:42 CET - Thu 2026-03-16 23:01:15 CET
-1 456def789abc Fri 2026-03-17 09:02:18 CET - Sat 2026-03-18 02:30:45 CET
 0 789abc012def Sat 2026-03-18 08:00:01 CET - Sat 2026-03-18 14:22:33 CET
Filtering by Priority
# Show only errors and above from current boot
journalctl -b -p err

# Show warnings and above
journalctl -b -p warning

# Show critical messages only
journalctl -b -p crit

# Show errors from previous boot (great for crash analysis)
journalctl -b -1 -p err
Filtering by Unit/Service
# Show boot messages for a specific service
journalctl -b -u sshd
journalctl -b -u nginx
journalctl -b -u NetworkManager

# Show kernel messages only (equivalent to dmesg)
journalctl -b -k

# Show messages from multiple units
journalctl -b -u sshd -u nginx -u php-fpm
Time-Based Filtering
# Show boot messages from a specific date
journalctl --since "2026-03-18 08:00:00" --until "2026-03-18 08:05:00"

# Show the first 2 minutes of the current boot
journalctl -b --since "$(journalctl -b -o short-unix | head -1 | awk '{print $1}')" \
    --until "+2min"

# Show messages from the last hour
journalctl --since "1 hour ago"
Output Formats
# JSON output (great for parsing/automation)
journalctl -b -o json-pretty | head -50

# Verbose output (shows all metadata fields)
journalctl -b -o verbose | head -100

# Short output with precise timestamps
journalctl -b -o short-precise

# Export format (for archiving)
journalctl -b --output=export > boot-log-export.bin
Enabling Persistent Boot Logs
By default, many Linux distributions store journal logs only in memory (/run/log/journal/), which means boot logs are lost after reboot. To keep boot logs across reboots, you need to enable persistent storage.
Method A: Create the Journal Directory
# Create persistent journal storage directory
sudo mkdir -p /var/log/journal

# Set correct ownership
sudo systemd-tmpfiles --create --prefix /var/log/journal

# Restart the journal service
sudo systemctl restart systemd-journald

# Verify persistent storage is active
journalctl --disk-usage
journalctl --list-boots
Method B: Configure journald.conf
# Edit the journal configuration
sudo nano /etc/systemd/journald.conf

# Set these values:
[Journal]
Storage=persistent
Compress=yes
SystemMaxUse=500M
SystemMaxFileSize=50M
MaxRetentionSec=3month
ForwardToSyslog=yes
After editing, restart the journal daemon:
sudo systemctl restart systemd-journaldConfiguration Options Explained
| Option | Description | Recommended Value |
|---|---|---|
| Storage | Where to store logs | persistent |
| Compress | Compress stored logs | yes |
| SystemMaxUse | Maximum disk space for logs | 500M - 2G |
| SystemMaxFileSize | Maximum size per log file | 50M - 100M |
| MaxRetentionSec | Maximum age of log entries | 1month - 1year |
| RateLimitIntervalSec | Rate limit interval | 30s |
| RateLimitBurst | Max messages in interval | 10000 |
| ForwardToSyslog | Also send to rsyslog | yes (for compatibility) |
systemd-analyze: Boot Performance Analysis
systemd-analyze is a powerful tool for understanding how long each part of the boot process takes. It helps identify slow services and bottlenecks.
Basic Boot Time Analysis
# Show overall boot time breakdown
systemd-analyze

# Example output:
# Startup finished in 2.531s (firmware) + 1.283s (loader) + 2.891s (kernel)
#     + 8.445s (userspace) = 15.151s
# graphical.target reached after 8.333s in userspace
Service-Level Timing
# Show time taken by each service (blame)
systemd-analyze blame

# Example output (sorted by time):
# 5.234s NetworkManager-wait-online.service
# 2.891s snapd.service
# 1.445s dev-sda1.device
# 1.023s systemd-journal-flush.service
# 0.891s docker.service
# 0.445s ssh.service

# Show critical chain (boot dependency path)
systemd-analyze critical-chain

# Show critical chain for a specific target
systemd-analyze critical-chain multi-user.target
Generate Boot Visualization
# Generate an SVG chart of the boot process
systemd-analyze plot > boot-chart.svg

# View in browser or image viewer
# This shows a detailed timeline of every service startup

# Generate a DOT graph of service dependencies
systemd-analyze dot | dot -Tsvg > boot-dependencies.svg
Traditional Log Files
While systemd journal is the modern standard, traditional log files remain important, especially on older systems or when rsyslog is configured:
# Traditional boot log (if boot logging is enabled)
/var/log/boot.log

# Kernel messages (populated by rsyslog)
/var/log/kern.log

# System messages
/var/log/syslog        # Debian/Ubuntu
/var/log/messages      # RHEL/AlmaLinux

# Authentication during boot
/var/log/auth.log      # Debian/Ubuntu
/var/log/secure        # RHEL/AlmaLinux
Enable boot.log on systemd Systems
# On some distributions, boot.log is disabled by default
# Enable it via the bootlog service

# Check if bootlog service exists
systemctl status bootlogd 2>/dev/null || systemctl status plymouth-read-write

# On Debian/Ubuntu, install bootlogd if needed
sudo apt install bootlogd
sudo systemctl enable bootlogd
Advanced Boot Debugging with GRUB
For deep boot debugging, you can modify GRUB bootloader parameters to increase kernel verbosity or redirect boot output:
Temporary (Single Boot)
# At GRUB menu, press 'e' to edit boot entry
# Find the line starting with 'linux' and modify:

# Remove 'quiet' and 'splash' to see all boot messages
linux /vmlinuz-5.15.0 root=/dev/sda1 ro

# Add verbose mode
linux /vmlinuz-5.15.0 root=/dev/sda1 ro debug

# Enable early printk for hardware debugging
linux /vmlinuz-5.15.0 root=/dev/sda1 ro earlyprintk=vga

# Log to serial console (for headless servers)
linux /vmlinuz-5.15.0 root=/dev/sda1 ro console=ttyS0,115200

# Press Ctrl+X or F10 to boot with these parameters
Permanent GRUB Changes
# Edit GRUB defaults
sudo nano /etc/default/grub

# Remove quiet and splash for verbose boot
GRUB_CMDLINE_LINUX_DEFAULT=""

# Or keep quiet but enable logging
GRUB_CMDLINE_LINUX_DEFAULT="loglevel=7"

# For serial console logging
GRUB_CMDLINE_LINUX="console=tty0 console=ttyS0,115200n8"

# Update GRUB configuration
sudo update-grub          # Debian/Ubuntu
sudo grub2-mkconfig -o /boot/grub2/grub.cfg   # RHEL/AlmaLinux
Kernel Log Levels
| Level | Name | Messages Shown |
|---|---|---|
| 0 | KERN_EMERG | System is unusable |
| 1 | KERN_ALERT | Immediate action needed |
| 2 | KERN_CRIT | Critical conditions |
| 3 | KERN_ERR | Error conditions |
| 4 | KERN_WARNING | Warning conditions (default) |
| 5 | KERN_NOTICE | Normal but significant |
| 6 | KERN_INFO | Informational |
| 7 | KERN_DEBUG | Debug messages (most verbose) |
Boot Troubleshooting Scenarios
Scenario 1: System Hangs During Boot
# 1. Remove 'quiet splash' from GRUB to see where it hangs
# 2. Boot into rescue mode: add 'systemd.unit=rescue.target' to kernel line
# 3. Once in rescue mode, check logs:
journalctl -b -p err
dmesg --level=err,crit
systemd-analyze blame
systemd-analyze critical-chain
Scenario 2: Service Fails at Boot
# Check which services failed
systemctl --failed

# Get detailed logs for the failed service
journalctl -b -u failed-service-name.service

# Check service dependencies
systemctl list-dependencies failed-service-name.service

# Check service status with detailed output
systemctl status failed-service-name.service -l
Scenario 3: Filesystem Issues at Boot
# Check filesystem mount messages
journalctl -b | grep -i "mount\|fsck\|filesystem\|ext4\|xfs\|btrfs"

# Check for disk errors
dmesg | grep -i "error\|fail\|i/o\|read\|write\|ata"

# Check fstab for issues
cat /etc/fstab
mount -a  # Try to mount all (in rescue mode)
Scenario 4: Network Not Available After Boot
# Check network-related boot messages
journalctl -b -u NetworkManager
journalctl -b -u systemd-networkd
journalctl -b -u networking

# Check interface detection during boot
dmesg | grep -i "eth\|ens\|enp\|wlan\|link"

# Check if network-online.target was reached
systemctl status network-online.target
Automating Boot Log Collection
For servers that you manage remotely, setting up automated boot log collection is essential:
Boot Log Collection Script
#!/bin/bash
# /usr/local/bin/collect-boot-logs.sh
# Run via cron or systemd timer after boot

LOG_DIR="/var/log/boot-analysis"
mkdir -p "$LOG_DIR"
TIMESTAMP=$(date +%Y%m%d-%H%M%S)

# Capture dmesg
dmesg -T > "$LOG_DIR/dmesg-$TIMESTAMP.log"

# Capture journal boot log
journalctl -b --no-pager > "$LOG_DIR/journal-$TIMESTAMP.log"

# Capture boot errors only
journalctl -b -p err --no-pager > "$LOG_DIR/errors-$TIMESTAMP.log"

# Capture boot timing
systemd-analyze > "$LOG_DIR/timing-$TIMESTAMP.txt"
systemd-analyze blame >> "$LOG_DIR/timing-$TIMESTAMP.txt"

# Capture failed services
systemctl --failed --no-pager >> "$LOG_DIR/timing-$TIMESTAMP.txt"

# Keep only last 30 days of logs
find "$LOG_DIR" -name "*.log" -mtime +30 -delete
find "$LOG_DIR" -name "*.txt" -mtime +30 -delete

echo "Boot logs collected: $LOG_DIR/*-$TIMESTAMP.*"
Systemd Timer for Automatic Collection
# /etc/systemd/system/boot-log-collector.service
[Unit]
Description=Collect boot logs for analysis
After=multi-user.target

[Service]
Type=oneshot
ExecStart=/usr/local/bin/collect-boot-logs.sh

# /etc/systemd/system/boot-log-collector.timer
[Unit]
Description=Run boot log collector after each boot

[Timer]
OnBootSec=2min
Unit=boot-log-collector.service

[Install]
WantedBy=timers.target
# Enable the timer
sudo systemctl daemon-reload
sudo systemctl enable boot-log-collector.timerRemote Boot Logging with rsyslog
For centralized logging across multiple servers, configure rsyslog to forward boot messages to a central log server:
# On the client (server being monitored):
# /etc/rsyslog.d/50-remote-boot.conf
kern.*    @@logserver.example.com:514
*.err     @@logserver.example.com:514

# On the log server:
# /etc/rsyslog.d/10-receive.conf
module(load="imtcp")
input(type="imtcp" port="514")

template(name="RemoteHost" type="string"
    string="/var/log/remote/%HOSTNAME%/%PROGRAMNAME%.log")

*.* ?RemoteHost
Security Considerations for Boot Logs
Boot logs can contain sensitive information. Follow these security practices:
- Restrict access -- journal logs are readable by the
systemd-journalgroup. Only add trusted users to this group - Encrypt log storage -- if boot logs contain sensitive data, store them on encrypted partitions
- Monitor for tampering -- use
journalctl --verifyto check journal file integrity - Audit boot parameters -- monitor for unauthorized kernel parameter changes via GRUB
- Secure remote logging -- use TLS when forwarding logs to remote servers
- Retention policy -- set appropriate
MaxRetentionSecto comply with your data retention requirements
# Verify journal integrity
journalctl --verify

# Check who has access to journal logs
getent group systemd-journal

# Restrict journal access
sudo chmod 2750 /var/log/journal/
sudo chown root:systemd-journal /var/log/journal/
Quick Reference: Essential Boot Logging Commands
| Task | Command |
|---|---|
| View kernel boot messages | dmesg -T |
| View current boot journal | journalctl -b |
| View previous boot journal | journalctl -b -1 |
| List all boot sessions | journalctl --list-boots |
| Boot errors only | journalctl -b -p err |
| Kernel messages from journal | journalctl -b -k |
| Service boot log | journalctl -b -u servicename |
| Boot time analysis | systemd-analyze |
| Service startup times | systemd-analyze blame |
| Boot critical path | systemd-analyze critical-chain |
| Failed services | systemctl --failed |
| Follow new kernel messages | dmesg -w |
| Enable persistent journal | sudo mkdir -p /var/log/journal |
| Journal disk usage | journalctl --disk-usage |
| Verify journal integrity | journalctl --verify |
Free PDF Cheat Sheet Download
We have created a 10-page Linux Boot Logging cheat sheet covering dmesg, journalctl, systemd-analyze, GRUB parameters, persistent logging, boot troubleshooting scenarios, automation scripts, and a quick reference page with all essential commands.
Download Free Boot Logging Cheat Sheet (PDF)
Recommended Books for Deeper Learning
- Linux System Administration Handbook -- the comprehensive reference for managing Linux systems including boot configuration and system services
- Linux Troubleshooting Techniques -- essential guide to diagnosing and resolving Linux problems, including boot failures
- systemd Service Management -- deep dive into systemd, journald, and the modern Linux init system
- Linux Security Hardening -- learn how to secure your boot process and log infrastructure
- Linux System Administration for Beginners -- start your Linux admin journey with clear, practical guidance
Conclusion
Linux boot logging is a fundamental skill that every system administrator needs. The combination of dmesg for kernel messages, journalctl for comprehensive system logs, and systemd-analyze for performance analysis gives you complete visibility into what happens when your Linux system starts. By enabling persistent journal storage and setting up automated log collection, you ensure that boot information is always available when you need it most -- when something goes wrong.
Remember: the best time to set up boot logging is before you need it. Configure persistent storage, remove the quiet parameter from GRUB for troubleshooting servers, and familiarize yourself with journalctl filtering before your next boot emergency.
Updated: March 2026. All commands tested on Debian 12, Ubuntu 24.04 LTS, RHEL 9, AlmaLinux 9, and Fedora 41.