Why Log Management Is a Non-Negotiable Skill for System Administrators
Logs are the black box of your Linux systems. When a service crashes at 3 AM, when a security breach occurs, when performance degrades mysteriously — logs are where you find the truth. Yet many administrators only look at logs reactively, after something has already gone wrong.
Modern Linux systems generate an enormous volume of log data. A typical production server can produce gigabytes of logs per day from the kernel, systemd services, web servers, databases, application code, and security systems. Without proper log management, this data is noise. With proper management, it becomes your most valuable diagnostic and security tool.
This guide covers the complete Linux logging stack — from reading individual log entries with journalctl to building an enterprise-grade centralized logging pipeline with the ELK Stack.
Production Reality: According to a 2025 survey by Datadog, organizations that implement centralized logging resolve incidents 73% faster than those relying on manual log inspection. The average MTTR (Mean Time to Resolution) drops from 4.2 hours to 1.1 hours.
The Linux Logging Architecture
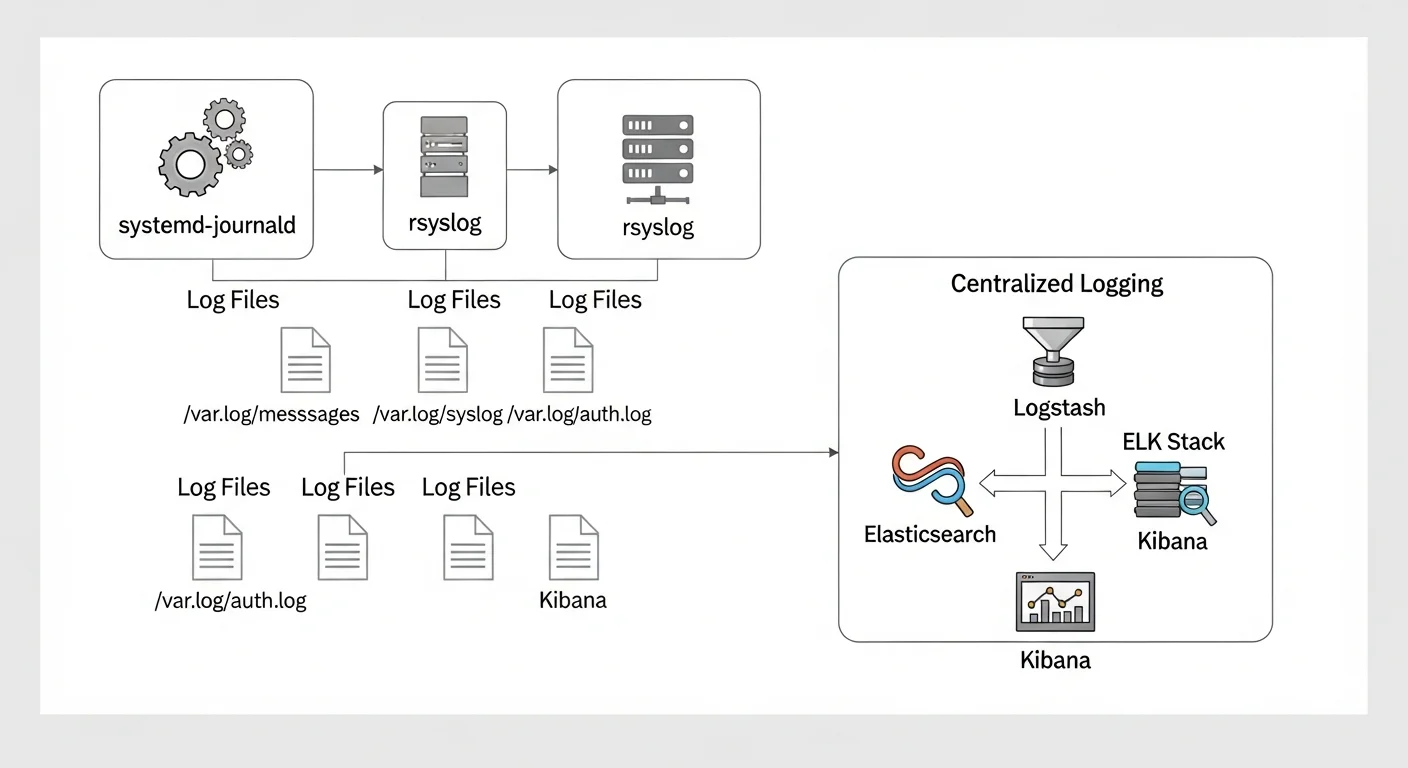
Modern Linux distributions use a dual logging system:
- systemd-journald — The binary journal that captures all systemd service output, kernel messages, and early boot messages
- rsyslog (or syslog-ng) — The traditional text-based logging daemon that writes to
/var/log/files
These two systems work together. journald captures everything first, then forwards messages to rsyslog, which writes them to traditional log files. Understanding this flow is essential for effective log management.
Source: freedesktop.org — systemd-journald Documentation
Mastering journalctl
The journalctl command is your primary tool for querying the systemd journal. It is far more powerful than most administrators realize.
Essential journalctl Commands
# View all logs (newest last)
journalctl

# Follow logs in real-time (like tail -f)
journalctl -f

# Show logs from the current boot only
journalctl -b

# Show logs from the previous boot
journalctl -b -1

# Show only error and critical messages
journalctl -p err

# Show logs from a specific time range
journalctl --since "2026-02-25 08:00" --until "2026-02-25 12:00"

# Show logs from the last 30 minutes
journalctl --since "30 min ago"

# Show logs from a specific service
journalctl -u nginx.service
journalctl -u postgresql.service --since today

# Show kernel messages only
journalctl -k

# Output in JSON format (great for parsing)
journalctl -u nginx -o json-pretty --since today

# Show disk usage of journal
journalctl --disk-usage

# Vacuum old logs (keep only last 500MB)
sudo journalctl --vacuum-size=500M

# Vacuum logs older than 2 weeks
sudo journalctl --vacuum-time=2weeks
Advanced journalctl Filtering
# Filter by process ID
journalctl _PID=1234

# Filter by executable path
journalctl _EXE=/usr/sbin/nginx

# Filter by user ID
journalctl _UID=1000

# Combine multiple filters (AND logic)
journalctl -u nginx -p warning --since today

# Show logs with specific syslog identifier
journalctl -t sshd

# Search for specific text in log messages
journalctl -u nginx --grep="error|failed" --case-sensitive=no

# Show only the last 50 entries
journalctl -n 50

# Reverse order (newest first)
journalctl -r -n 20
Source: man7.org — journalctl(1) Man Page
Configuring Journal Persistence
By default, on some distributions, the journal is stored in memory and lost on reboot. To make it persistent:
# Create the persistent journal directory
sudo mkdir -p /var/log/journal
sudo systemd-tmpfiles --create --prefix /var/log/journal

# Edit journal configuration
sudo nano /etc/systemd/journald.conf
# /etc/systemd/journald.conf
[Journal]
Storage=persistent
Compress=yes
SystemMaxUse=2G
SystemMaxFileSize=256M
MaxRetentionSec=3month
ForwardToSyslog=yes# Restart journald to apply changes
sudo systemctl restart systemd-journaldrsyslog Advanced Configuration
While journalctl is excellent for interactive log queries, rsyslog provides the traditional text-based logging that many tools and scripts expect. It is also the foundation for forwarding logs to centralized systems.
Understanding Log Facilities and Priorities
| Priority Level | Keyword | Value | Description |
|---|---|---|---|
| Emergency | emerg | 0 | System is unusable |
| Alert | alert | 1 | Immediate action required |
| Critical | crit | 2 | Critical conditions |
| Error | err | 3 | Error conditions |
| Warning | warning | 4 | Warning conditions |
| Notice | notice | 5 | Normal but significant |
| Info | info | 6 | Informational messages |
| Debug | debug | 7 | Debug-level messages |
Custom rsyslog Rules
# /etc/rsyslog.d/50-custom.conf

# Send all auth messages to a separate file
auth,authpriv.*    /var/log/auth.log

# Send all mail-related logs to mail.log
mail.*             /var/log/mail.log

# Send critical and above to a separate alert file
*.crit             /var/log/critical.log

# Send nginx logs to a dedicated file using programname
if $programname == "nginx" then /var/log/nginx/error.log
& stop

# Template for structured log format
template(name="DetailedFormat" type="string"
    string="%timegenerated% %HOSTNAME% %syslogtag%%msg%\n"
)

# Use the template for all messages
*.* /var/log/detailed.log;DetailedFormat
Source: rsyslog Official Documentation
Forwarding Logs to a Remote Server
# /etc/rsyslog.d/60-remote.conf

# Forward all logs to central log server via TCP (reliable)
*.* @@logserver.example.com:514

# Forward only critical messages via UDP (faster but unreliable)
*.crit @logserver.example.com:514

# Forward with TLS encryption
$DefaultNetstreamDriverCAFile /etc/ssl/certs/ca.pem
$ActionSendStreamDriver gtls
$ActionSendStreamDriverMode 1
$ActionSendStreamDriverAuthMode x509/name
*.* @@logserver.example.com:6514
Log Rotation with logrotate
Without log rotation, log files will grow until they fill your disk. logrotate handles this automatically:
# /etc/logrotate.d/nginx
/var/log/nginx/*.log {
    daily
    missingok
    rotate 30
    compress
    delaycompress
    notifempty
    create 0640 www-data adm
    sharedscripts
    postrotate
        [ -f /var/run/nginx.pid ] && kill -USR1 $(cat /var/run/nginx.pid)
    endscript
}

# /etc/logrotate.d/app-custom
/var/log/myapp/*.log {
    weekly
    rotate 12
    compress
    delaycompress
    missingok
    notifempty
    size 100M
    create 0644 appuser appuser
}
# Test logrotate configuration (dry run)
sudo logrotate -d /etc/logrotate.d/nginx
# Force rotation manually
sudo logrotate -f /etc/logrotate.d/nginx
# Check logrotate status
cat /var/lib/logrotate/statusSource: man7.org — logrotate(8) Man Page
Building a Centralized Logging Pipeline with ELK Stack
For multi-server environments, centralized logging is essential. The ELK Stack (Elasticsearch, Logstash, Kibana) is the industry standard for log aggregation and analysis.
Architecture Overview
| Component | Role | Port |
|---|---|---|
| Filebeat | Lightweight log shipper (installed on each server) | N/A (outbound only) |
| Logstash | Log processing, parsing, and transformation | 5044 (Beats input) |
| Elasticsearch | Log storage, indexing, and search engine | 9200 (HTTP), 9300 (Transport) |
| Kibana | Web UI for visualization and dashboards | 5601 |
Filebeat Configuration (on Each Server)
# /etc/filebeat/filebeat.yml
filebeat.inputs:
  - type: log
    enabled: true
    paths:
      - /var/log/syslog
      - /var/log/auth.log
    fields:
      server_role: webserver
      environment: production

  - type: log
    enabled: true
    paths:
      - /var/log/nginx/access.log
    fields:
      log_type: nginx_access

  - type: log
    enabled: true
    paths:
      - /var/log/nginx/error.log
    fields:
      log_type: nginx_error

output.logstash:
  hosts: ["logserver.example.com:5044"]
  ssl.certificate_authorities: ["/etc/filebeat/ca.pem"]
Logstash Pipeline Configuration
# /etc/logstash/conf.d/01-syslog.conf
input {
  beats {
    port => 5044
    ssl => true
    ssl_certificate => "/etc/logstash/certs/logstash.crt"
    ssl_key => "/etc/logstash/certs/logstash.key"
  }
}

filter {
  if [fields][log_type] == "nginx_access" {
    grok {
      match => { "message" => "%{COMBINEDAPACHELOG}" }
    }
    geoip {
      source => "clientip"
    }
  }

  date {
    match => [ "timestamp", "dd/MMM/yyyy:HH:mm:ss Z" ]
  }
}

output {
  elasticsearch {
    hosts => ["http://localhost:9200"]
    index => "logs-%{+YYYY.MM.dd}"
  }
}
Source: Elastic — Elasticsearch Reference | Logstash Reference
Essential Log Analysis Commands
# Find the top 10 IP addresses hitting your web server
awk "{print \}" /var/log/nginx/access.log | sort | uniq -c | sort -rn | head -10

# Find all failed SSH login attempts
grep "Failed password" /var/log/auth.log | awk "{print \1}" | sort | uniq -c | sort -rn

# Count log entries per hour (useful for spotting traffic patterns)
awk -F: "{print \":\"\}" /var/log/nginx/access.log | uniq -c

# Find all error-level messages from today
journalctl -p err --since today --no-pager

# Monitor multiple log files simultaneously
multitail /var/log/nginx/access.log /var/log/nginx/error.log

# Search compressed rotated logs
zgrep "error" /var/log/syslog.*.gz
Log Management Best Practices Checklist
| Category | Practice | Priority |
|---|---|---|
| Storage | Enable journal persistence across reboots | Critical |
| Storage | Configure logrotate for all log-producing services | Critical |
| Storage | Set maximum journal size (SystemMaxUse) | High |
| Security | Forward auth logs to a separate, secured server | Critical |
| Security | Use TLS for remote log forwarding | High |
| Security | Restrict log file permissions (0640 or stricter) | High |
| Monitoring | Set up alerts for critical/emergency log entries | Critical |
| Monitoring | Monitor disk usage of log directories | High |
| Analysis | Implement centralized logging for 3+ servers | High |
| Analysis | Create Kibana dashboards for key metrics | Medium |
| Retention | Define and enforce log retention policies | High |
| Compliance | Ensure logs meet regulatory requirements (GDPR, PCI) | Critical |