Quick summary: OpenTelemetry metrics have matured from "interesting alternative" to "production-ready and increasingly the default" in 2026. The OTel collector handles ingestion from OTel SDKs and Prometheus scraping simultaneously, exports to Prometheus/Mimir/Cortex/vendor backends, and adds value via processors (filtering, enrichment, batching). Migrating from Prometheus-native instrumentation to OTel metrics is a multi-month project for a typical organization but pays back through unified telemetry pipelines, vendor-agnostic instrumentation, and the ability to enrich metrics with trace context. This guide covers the why, the architecture, the migration plan, and the operational patterns that make OTel work in production.
Why OpenTelemetry Now?
The case for OpenTelemetry has crystallized in 2026 around three concrete benefits:
- One SDK, three signals. Traces, metrics, and logs come from the same SDK in your application code. Less library churn, consistent semantic conventions across signals, easy correlation between trace spans and emitted metrics.
- Vendor-agnostic instrumentation. Your code emits OTLP (OpenTelemetry Protocol). The collector translates to whatever backend you use today (Prometheus, Datadog, New Relic, etc.). Switching backends becomes a configuration change, not a code change.
- Pipeline value-add. The collector is genuinely useful: it can sample, filter, batch, transform, enrich, and route telemetry. Many organizations have eliminated dedicated ingestion-side processing by leveraging collector capabilities.
The case against is mostly historical: until 2023-2024, OTel metrics had performance issues and feature gaps relative to Prometheus-native instrumentation. Those gaps have closed. By 2026, OTel metrics are production-ready for typical workloads.
The Architecture Overview
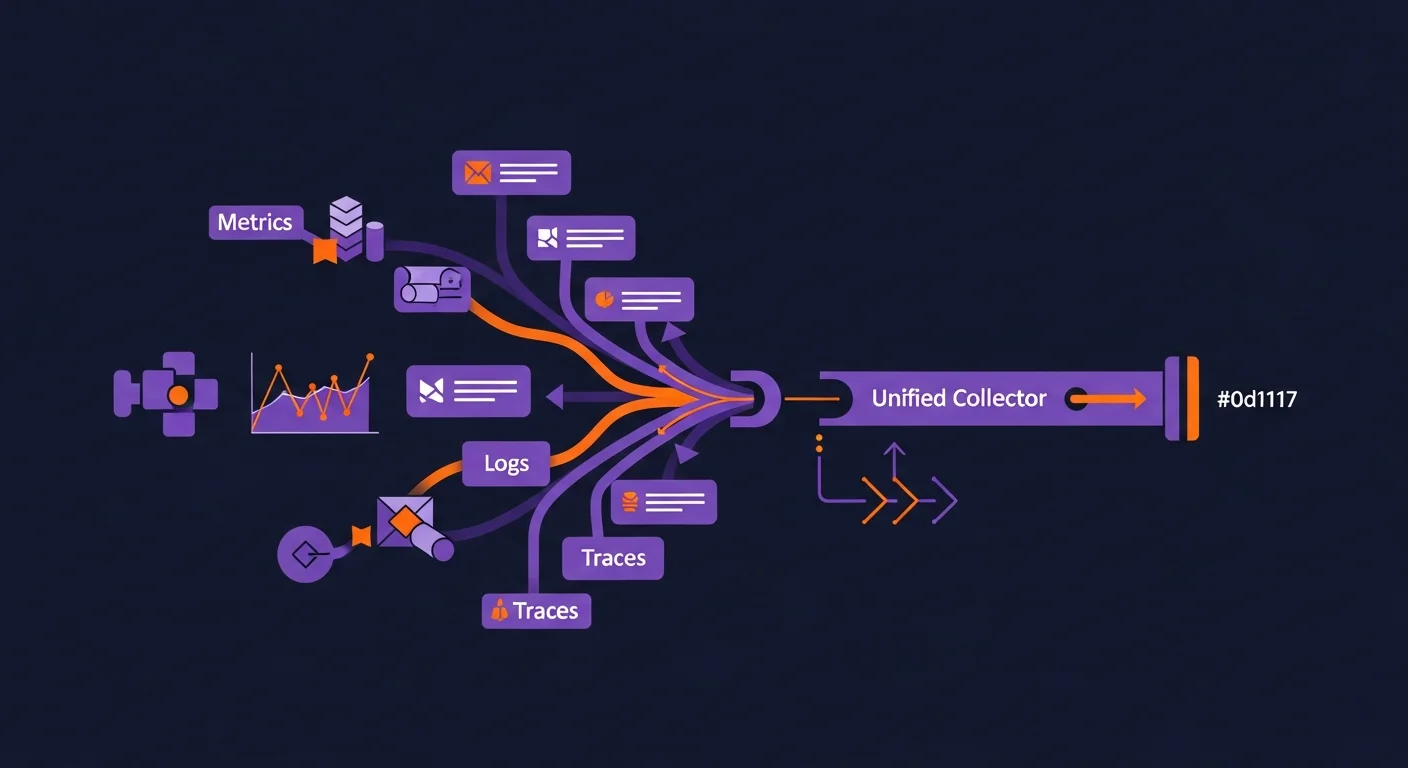
A typical OTel-based metrics pipeline:
Application (with OTel SDK)
  ↓ OTLP (gRPC or HTTP)
OTel Collector (agent, on each host or each pod)
  ↓ OTLP
OTel Collector (gateway, centralized)
  ↓ Multiple exports
Prometheus / Mimir / Datadog / Custom backend
Three components are doing real work:
- Application SDK: emits metrics via OTLP. The application code uses OpenTelemetry's Meter API.
- Agent collector: sidecar or DaemonSet. Performs local enrichment (host metadata), batching, retries.
- Gateway collector: centralized cluster of collectors. Performs heavier processing (sampling, transformation), exports to backends.
For smaller deployments, you can collapse agent + gateway into a single collector. For larger deployments, the two-layer pattern reduces backpressure on application sidecars and provides a single point for cross-cluster aggregation.
The Critical Concept: Semantic Conventions
The biggest practical advantage of OTel over ad-hoc Prometheus instrumentation is semantic conventions. Standard names and meanings for common attributes ensure that metrics from different services use the same labels.
Examples from the OTel spec:
http.request.methodinstead ofmethodorverborhttp_methodhttp.response.status_codeinstead ofstatusorcodeorresponse_codeservice.nameinstead ofapporserviceorapplicationdb.systemwith values likepostgresql,mysql,mongodbfor consistent database categorization
The payoff: dashboards and alerts that work across services without per-service customization. A "request rate by status code" panel works the same way for every HTTP service in your fleet because they all use the same attribute names.
Migration Plan: A Realistic 6-Month Timeline
Month 1: Stand up the collector
- Deploy the OTel Collector as a DaemonSet (Kubernetes) or systemd service (VMs).
- Configure it with two pipelines initially: Prometheus scrape (existing metrics) → Prometheus remote_write (existing backend), and OTLP receive → Prometheus remote_write (new path).
- Verify both pipelines work. Existing Prometheus metrics continue to flow.
Month 2: Pilot with one service
- Pick a non-critical service. Add the OpenTelemetry SDK alongside its existing Prometheus client library.
- Emit the same metrics through both paths in parallel.
- Compare values in dashboards. Validate they agree.
- Tune SDK configuration: temporality (cumulative vs delta), aggregation, attribute cardinality.
Month 3-4: Roll out OTel SDKs to remaining services
- One service per week or so, depending on team capacity.
- Each service: add SDK, emit dual metrics, validate parity, declare done.
- Update service templates and golden paths so new services use OTel by default.
Month 5: Switch dashboards and alerts to OTel-source metrics
- Update dashboards to query metrics via the OTel-emitted names.
- Update alerting rules.
- Watch for differences between old and new pipelines. Sometimes the OTel SDK's default histogram boundaries differ from your hand-tuned Prometheus client setup.
Month 6: Decommission Prometheus client libraries
- Once all dashboards and alerts use OTel-sourced metrics, remove the Prometheus client library code from each service.
- Simplify CI builds (one fewer dependency).
- Document the transition for the team.
The Collector Configuration That Works
A practical agent collector config (for a DaemonSet on Kubernetes):
receivers:
  otlp:
    protocols:
      grpc:
        endpoint: 0.0.0.0:4317
      http:
        endpoint: 0.0.0.0:4318
  prometheus:
    config:
      scrape_configs:
        - job_name: 'kubernetes-pods'
          kubernetes_sd_configs:
            - role: pod
          relabel_configs:
            # ... standard pod scrape config

processors:
  batch:
    timeout: 10s
    send_batch_size: 8192
  memory_limiter:
    check_interval: 1s
    limit_mib: 1024
  resource:
    attributes:
      - key: cluster.name
        value: prod-eu-west-1
        action: upsert
      - key: deployment.environment
        value: production
        action: upsert
  attributes:
    actions:
      # Drop high-cardinality labels we do not need
      - key: pod_template_hash
        action: delete

exporters:
  otlphttp/gateway:
    endpoint: http://otel-gateway:4318
    compression: gzip

service:
  pipelines:
    metrics:
      receivers: [otlp, prometheus]
      processors: [memory_limiter, resource, attributes, batch]
      exporters: [otlphttp/gateway]
The gateway collector receives from agents and exports to backends:
receivers:
  otlp:
    protocols:
      grpc:
        endpoint: 0.0.0.0:4317
      http:
        endpoint: 0.0.0.0:4318

processors:
  batch:
    timeout: 30s
    send_batch_size: 32768

exporters:
  prometheusremotewrite:
    endpoint: http://mimir:8080/api/v1/push
    headers:
      X-Scope-OrgID: production
  # Optional: dual-write to a vendor for evaluation
  otlphttp/datadog:
    endpoint: https://api.datadoghq.com/api/v2/series
    headers:
      DD-API-KEY: ${env:DD_API_KEY}

service:
  pipelines:
    metrics:
      receivers: [otlp]
      processors: [batch]
      exporters: [prometheusremotewrite]
Application-Side Instrumentation
Python example
from opentelemetry import metrics
from opentelemetry.sdk.metrics import MeterProvider
from opentelemetry.sdk.metrics.export import PeriodicExportingMetricReader
from opentelemetry.exporter.otlp.proto.grpc.metric_exporter import OTLPMetricExporter

reader = PeriodicExportingMetricReader(
    OTLPMetricExporter(endpoint="http://otel-agent:4317"),
    export_interval_millis=10_000,
)
provider = MeterProvider(metric_readers=[reader])
metrics.set_meter_provider(provider)

meter = metrics.get_meter("my.service")
http_requests = meter.create_counter(
    "http.server.requests",
    description="HTTP server requests",
    unit="1",
)

# In a request handler
http_requests.add(1, attributes={
    "http.request.method": "GET",
    "http.route": "/api/users/{id}",
    "http.response.status_code": 200,
})
Go example
import (
    "go.opentelemetry.io/otel"
    "go.opentelemetry.io/otel/metric"
)

meter := otel.Meter("my.service")
httpRequests, _ := meter.Int64Counter(
    "http.server.requests",
    metric.WithDescription("HTTP server requests"),
)

// In a handler
httpRequests.Add(ctx, 1,
    metric.WithAttributes(
        attribute.String("http.request.method", "GET"),
        attribute.String("http.route", "/api/users/{id}"),
        attribute.Int("http.response.status_code", 200),
    ),
)
The pattern is identical across languages: get a meter, create instruments, record values with attributes following semantic conventions.
Cardinality: The Eternal Concern
The biggest operational risk in OTel metrics (same as Prometheus): high-cardinality labels causing time-series explosion. Bad attributes that frequently end up in metrics by mistake:
user.id— unbounded; almost always the wrong thing to put in metric attributes.request.id— same.http.urlwith full URL including query strings.error.messagewith detailed error text.
The collector can defend against these via the attributes processor (drop or hash specific keys). But the better defense is at instrumentation time: never emit user IDs or request IDs as metric attributes. Use them in trace spans where they belong.
The Histogram Question
OpenTelemetry's metric model includes both classic histograms (bucketed) and exponential histograms (HDR-style with auto-scaling buckets). Exponential histograms are dramatically more accurate for latency measurements but require backend support. As of 2026, Prometheus, Mimir, and most major backends support exponential histograms; older Prometheus deployments may need upgrading.
For new code, use exponential histograms for latency. For migrating existing dashboards (which assume classic bucketed histograms), classic histograms are the safer initial choice.
Common Migration Pitfalls
1. Different default histogram boundaries
The OTel SDK's default boundaries for HTTP latency histograms differ from common Prometheus client defaults. Your dashboards may show different p99 values from the same data because the buckets differ. Configure the SDK to match your dashboard expectations, or update dashboards.
2. Attribute name mismatches
OTel semantic conventions use dotted names (http.request.method); Prometheus client libraries often use underscored (http_method). Either standardize on one or use collector processors to translate.
3. Cumulative vs delta temporality
Prometheus is cumulative (counters always go up; rates are computed at query time). OTel supports both cumulative and delta. Use cumulative if you're staying on Prometheus-style backends; use delta if you're going to Datadog or similar push-based backends.
4. Export interval too short
Default OTel SDK export interval is often 30-60 seconds. If you're used to Prometheus's 15-second scrape, your dashboards will feel laggy. Tune export interval to match your backend's expected granularity.
5. Dropping data on backpressure
The collector's memory_limiter processor drops data when overloaded. Without monitoring on the collector itself, you can lose telemetry without noticing. Always monitor the collector's own metrics (it self-instruments).
Beyond the Basics: Where OTel Pays Off Most
The basic case for OTel (vendor-agnostic, unified SDK) is compelling enough on its own. The deeper benefits emerge once OTel is embedded in your operational practice:
Trace-aware metrics
Because traces and metrics share the same SDK and resource attributes, you can pivot between them naturally. A spike in your http.server.requests metric? Click through to the corresponding traces in the same time window, with the same service.name. The friction of "metrics in Prometheus, traces in Jaeger, separate tools" disappears when both speak OTel.
Exemplars
OTel histograms support exemplars — links from a histogram bucket to a specific trace ID. When you see a p99 latency spike, you can jump directly to a trace exhibiting that latency. This is built-in to the OTel data model; bolting it onto Prometheus-native instrumentation is much harder.
Resource attribute propagation
OTel's resource model attaches metadata (service.name, service.version, deployment.environment, k8s.pod.name) once at the SDK level. Every metric, trace, and log emitted by that SDK carries those attributes. No more manually adding labels to every metric instrument; the resource layer handles it consistently.
Pipeline programmability
The collector's processor model lets you transform telemetry in flight. Common patterns: drop debug-level logs in production but pass them in dev; sample 10% of successful traces but 100% of error traces; rewrite legacy attribute names to current semantic conventions; route specific telemetry to specialized backends. These are all configuration changes, not application code changes.
Multi-backend routing
Send a copy of metrics to your primary backend (Mimir), a sampled copy to a vendor (Datadog) for evaluation, and a filtered copy to a long-term-storage backend (Snowflake via S3). All from the same source telemetry, configured in the collector. This kind of flexibility is impractical with vendor-specific SDKs.
Frequently Asked Questions
Can I keep using Prometheus as my backend?
Yes — that is the most common pattern. The collector exports to Prometheus via remote_write. Your existing Prometheus/Mimir/Cortex deployment continues working.
Does OTel replace Prometheus the project?
No. Prometheus the storage backend remains essential. OTel replaces the client libraries and adds the collector layer. Many deployments are "OTel SDKs + OTel collector + Prometheus storage."
Is the OTel collector resource-heavy?
The agent (per-host) typically runs on 100-200 MB RAM and minimal CPU. The gateway scales linearly with throughput; for typical mid-sized deployments, a few cores and 2-4 GB RAM per gateway instance suffice.
What about the OTel-Prometheus rivalry?
It's largely resolved in 2026. Prometheus the project endorses OpenMetrics (which became a CNCF standard), and OpenMetrics maps cleanly to OTel. The two ecosystems coexist.
Should I migrate logs and traces to OTel too?
Traces, definitely yes — OTel won the tracing standardization battle convincingly. Logs are still in transition; OTel logs are workable but the ecosystem (especially log storage) is still catching up to Loki and Elasticsearch.
What about the eBPF auto-instrumentation efforts?
OpenTelemetry's eBPF auto-instrumentation work is mature for some languages (Go, Java) and emerging for others. Useful for adding observability to legacy services without code changes.
One Real Migration Story
A platform team we know migrated their internal observability stack from Prometheus-native instrumentation to OpenTelemetry over five months in late 2025. Motivation: they had three different observability vendors across the organization (Datadog for one product line, New Relic for another, Prometheus self-hosted for a third) and wanted a unified instrumentation layer that did not lock them in. Migration approach: deployed OTel collectors first, then rolled out SDKs service-by-service starting with the lowest-risk services. Discovered along the way that 30% of their services had non-standard metric naming that needed fixing during the migration anyway. Total effort: roughly 4 months of one engineer's full-time work plus part-time involvement from each service team. Outcome: unified instrumentation across all services, ability to switch backends per product line as commercial negotiations went, ~20% reduction in their observability vendor spend (negotiated leverage from being able to credibly switch). Net assessment: the migration paid back through commercial leverage alone within 18 months.
Further Reading from the Dargslan Library
- DevOps & Cloud category — observability, monitoring, and instrumentation patterns.
- Programming category — application instrumentation, structured logging, and tracing.
- Free cheat sheet library — printable references for OTel collector configs, semantic conventions, and PromQL.
- Dargslan eBook library — comprehensive observability and SRE courses.
The Bottom Line
OpenTelemetry metrics are production-ready in 2026 and worth the migration effort for organizations with non-trivial telemetry needs. The unified SDK story (one library for traces, metrics, logs) reduces ongoing instrumentation cost; the collector enables ingestion-side processing that adds genuine value; the vendor-agnostic protocol eliminates lock-in. Plan a 4-6 month migration, run dual-write during the transition, monitor cardinality carefully, and expect the result to be measurably better than Prometheus-native instrumentation alone. The unified-telemetry future has arrived; teams that adopt it benefit from cleaner pipelines and more leverage with vendors.